We Called the BTC & ETH Pullbacks. This Is Our Next Trade and the Key Charts to WatchActionable Market Insights
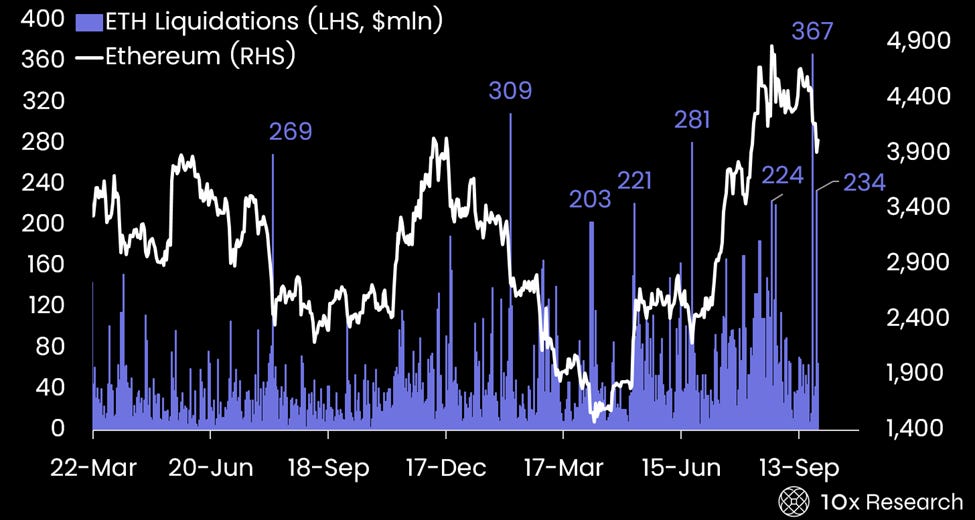
Why this report matters Bitcoin and Ethereum have both hit critical inflection points where past rallies have either launched or failed. On the surface, positioning looks cleaner, but the data reveal hidden leverage and a technical backdrop few are noticing. Volatility is compressing just as key multi-year support and resistance zones converge — a setup that often precedes explosive moves. Meanwhile, options markets are quietly shifting their bias, hinting at how big money is lining up for Q1/Q2 2026. Traders who only look at price are missing the structural clues that could define the next leg. Main argument As highlighted in our September 25 report, “From a technical perspective, we see scope for ETH to decline toward the $3,800 level,” and indeed, Ethereum reached a low of $3,815 on Binance on September 26, testing the upper boundary of its multi-year triangle formation. This six-year pattern remains a textbook example of long-term consolidation, and traders should focus on the larger structural picture it implies - as we explain below. Ethereum Liquidations (LHS, $ mln) vs. Ethereum (RHS)
Subscribe to 10x Research Market Updates to unlock the rest.Become a paying subscriber of 10x Research Market Updates to get access to this post and other subscriber-only content. A subscription gets you:
|
Friday, September 26, 2025
We Called the BTC & ETH Pullbacks. This Is Our Next Trade and the Key Charts to Watch




Subscribe to:
Post Comments (Atom)
No comments:
Post a Comment