The 5 Financial Metrics That Matter Most (and Why) VisualizedA practical guide to the numbers that separate great businesses from mediocre ones
Here’s a truth that most investing courses won’t tell you: You don’t need to track 47 different financial metrics to analyze a stock. I’ve been investing for 13 years and writing about fundamental analysis for over 9. In that time, I’ve analyzed hundreds of companies. And you know what I’ve learned? Most investors overwhelm themselves with spreadsheets full of ratios that don’t actually move the needle on their understanding of a business. The reality? Five core metrics will tell you almost everything you need to know about whether a company can:
Today, we’re breaking down those five metrics using real numbers from Microsoft’s latest quarterly report. You’ll see exactly how to calculate each one, understand what they’re really telling you, and most importantly, learn how to use them when analyzing your own stocks. No fluff. No jargon. Just the metrics that matter. Why These 5 Metrics?Before we dive in, let’s address the elephant in the room: why these five? Because they answer the most important questions about any business:
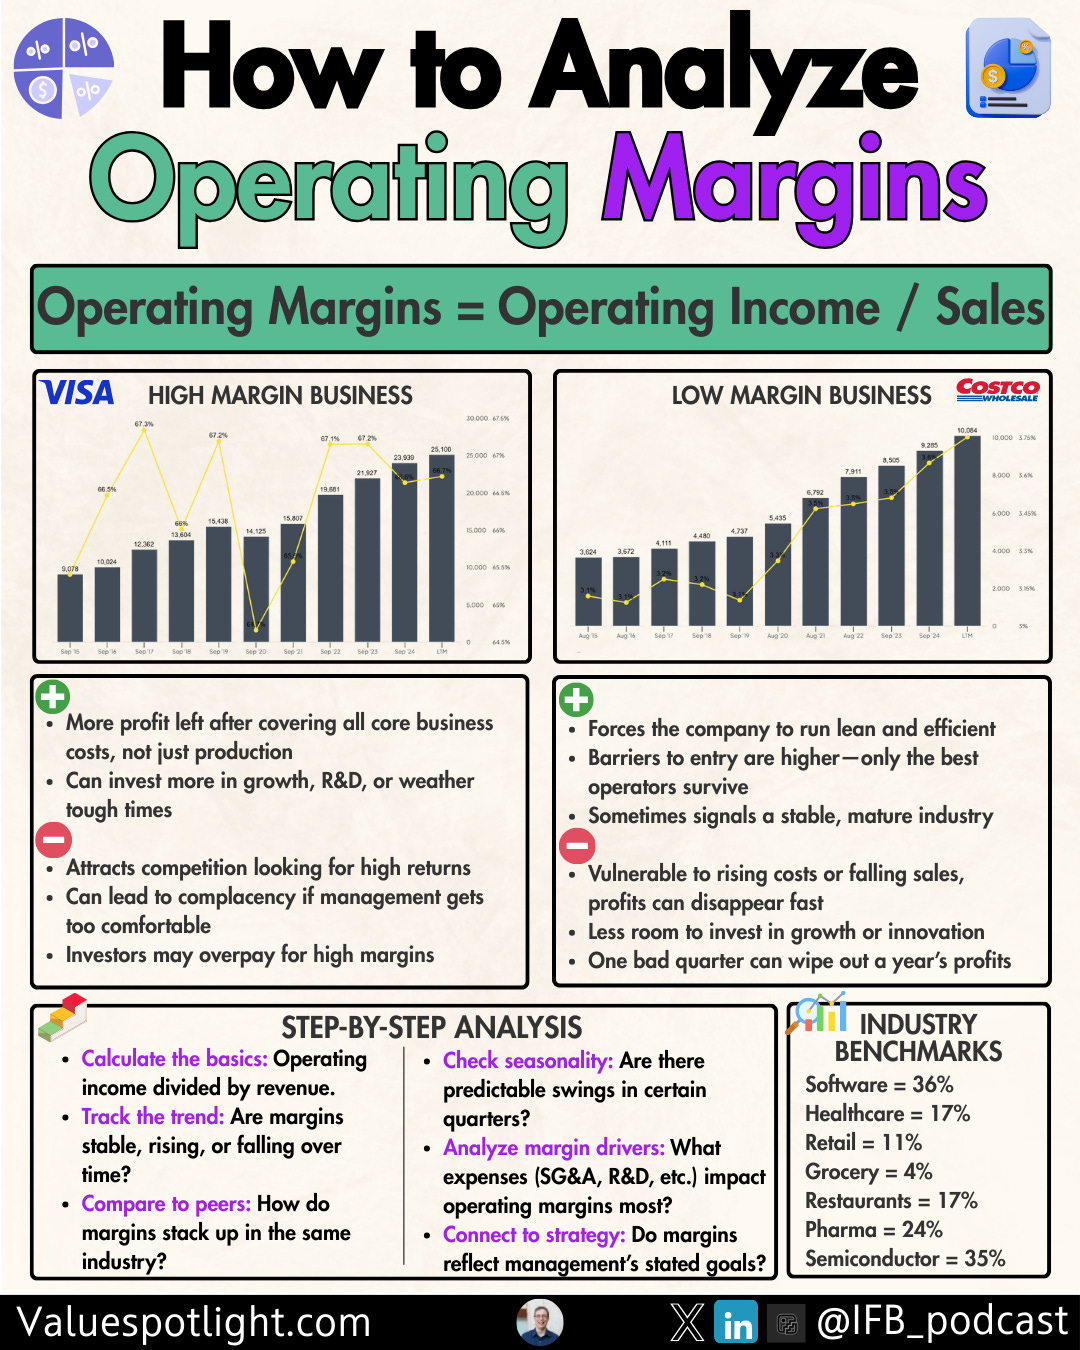
These aren’t arbitrary. They work together to paint a complete picture of business quality. Miss one, and you might invest in a company that looks good on paper but crumbles in reality. Let’s break them down. Metric #1: Operating Margin – The Efficiency TestWhat it measures: How much profit a company generates from its core operations for every dollar of revenue, before accounting for interest and taxes. The formula:
Why it matters: Operating margin tells you whether a company’s actual business model works. It strips away financial engineering, tax strategies, and one-time gains. What’s left is the pure economics of how the company makes money. A healthy operating margin means the company can:
Think of it this way: Revenue is vanity. Operating income is reality. What to look for:
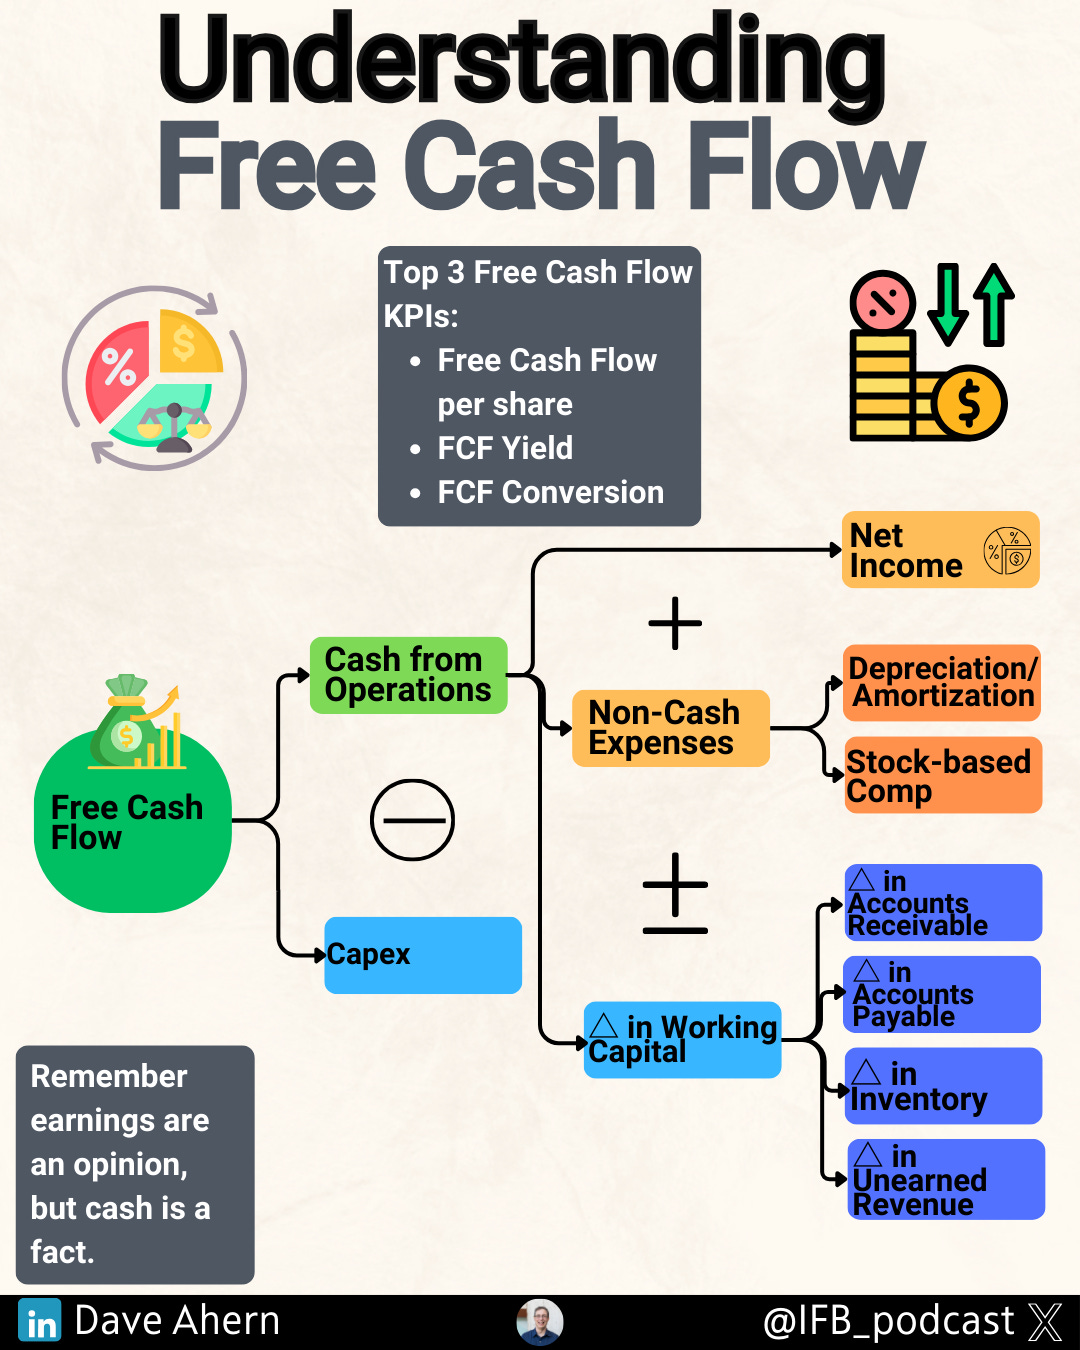
Industry context matters. A software company with 20% margins might be struggling. A retailer with 8% margins might be thriving. Always compare to industry peers. Metric #2: Free Cash Flow – The Truth TellerWhat it measures: The cash a company generates after paying to maintain and grow its business (capital expenditures). The formula:
Why it matters: This is my favorite metric because you can’t fake cash. Earnings can be manipulated through accounting choices, but cash flow doesn’t lie. Free cash flow represents the money available to:
Without consistent free cash flow, a company eventually runs into trouble, no matter how impressive its revenue growth looks. Warren Buffett puts it simply: “Cash is king.” What to look for:
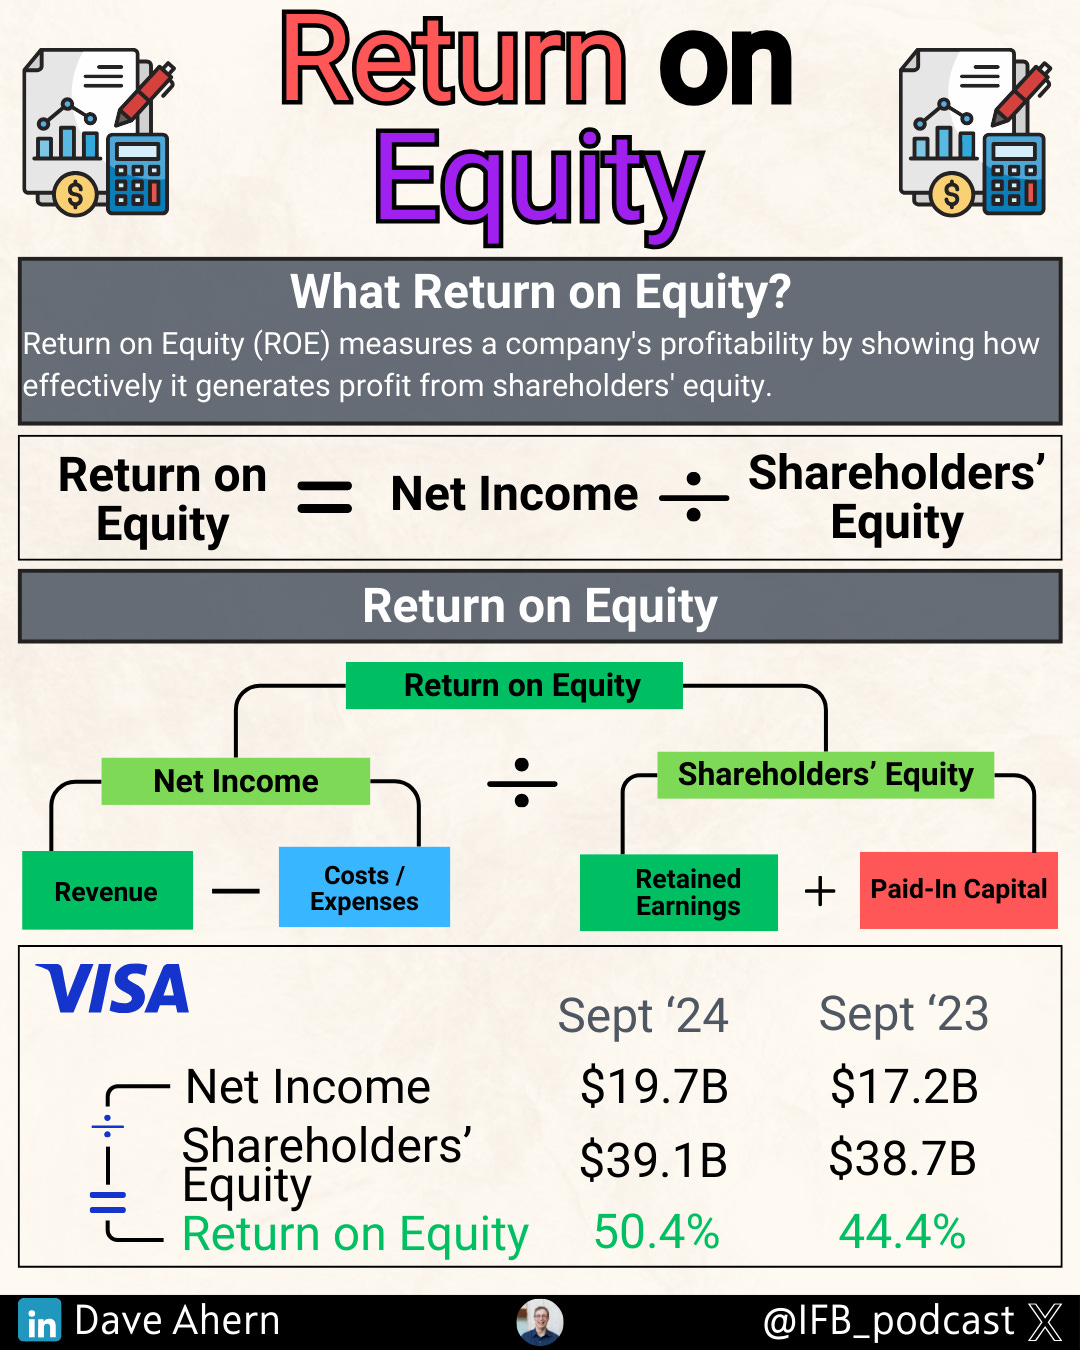
A quick reality check: If a company reports $1 billion in net income but only $100 million in free cash flow, ask yourself: where’s the other $900 million going? Metric #3: Return on Equity (ROE) – The Shareholder Value GeneratorWhat it measures: How effectively a company uses shareholders’ equity (money) to generate profits. The formula:
Why it matters: ROE answers a fundamental question: If I invest $100 in this company, how much profit will it generate? This metric reflects management’s capital-allocation skills. A high, sustainable ROE means the company doesn’t need to constantly raise new capital to grow—it can reinvest its own profits productively. Think of it as your scorecard for management effectiveness. What to look for:
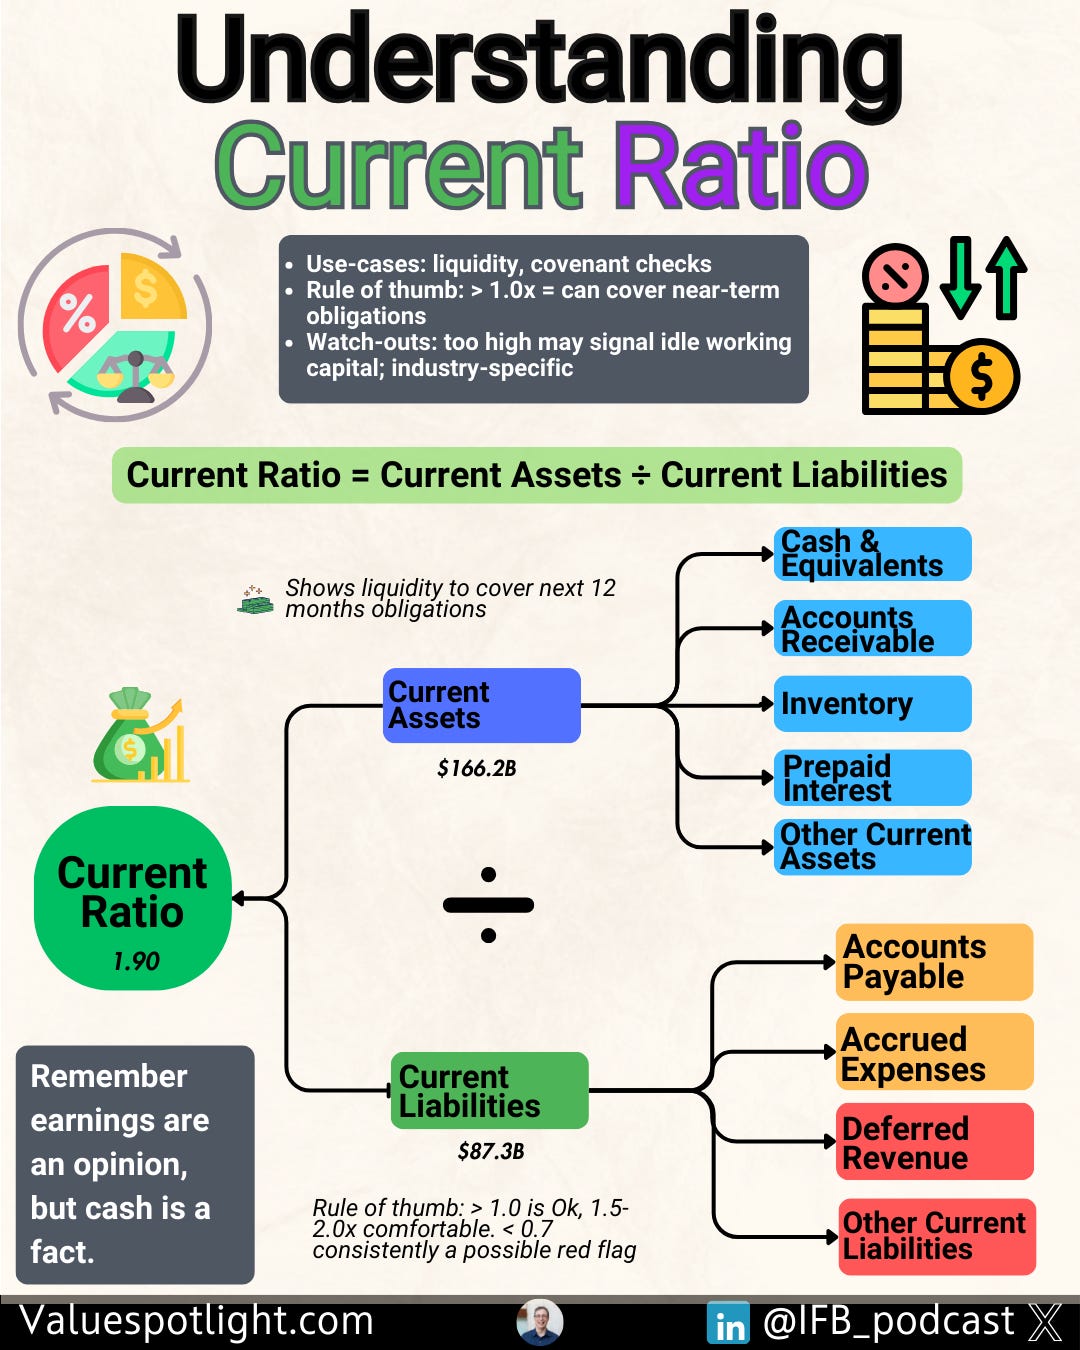
Important caveat: Be wary of companies using excessive debt to juice ROE. A company with $10 in equity and $90 in debt might show a 50% ROE, but that’s leverage-driven, not operational excellence. Cross-reference with the debt-to-equity ratio. Metric #4: Current Ratio – The Safety NetWhat it measures: A company’s ability to pay its short-term obligations (bills due within a year) using short-term assets (cash and things easily converted to cash). The formula:
Why it matters: Even profitable companies can fail if they can’t pay their bills. The current ratio tells you whether a company has enough liquid resources to handle near-term obligations without scrambling for emergency financing. This metric is your early warning system for financial distress. What to look for:
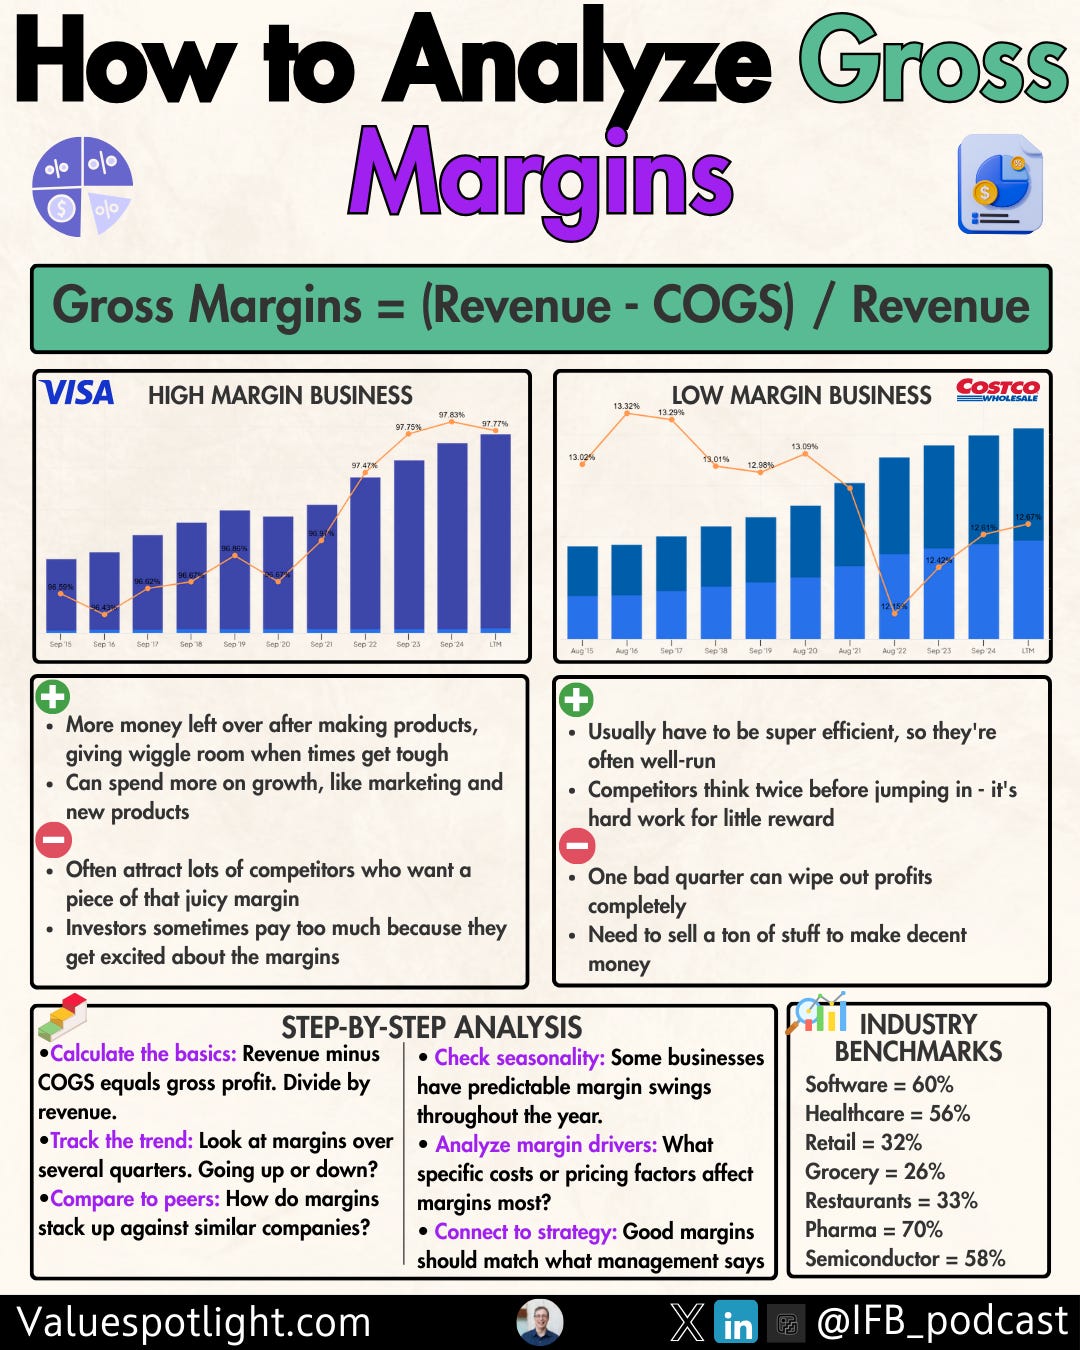
Context is critical: Tech companies often run lower current ratios because they generate cash quickly. Manufacturers need higher ratios due to inventory and longer cash cycles. Crisis test: During the 2020 pandemic, companies with strong current ratios survived. Those without had to raise expensive capital or cut operations. [VISUAL SUGGESTION: Place a gauge/speedometer visual showing Microsoft’s current ratio, with zones marked “danger,” “caution,” and “healthy”] Metric #5: Gross Margin – The Pricing Power IndicatorWhat it measures: The percentage of revenue left after subtracting the direct costs of producing goods or delivering services. The formula:
Why it matters: Gross margin reveals whether a company can charge more than it costs to deliver the product or service. High gross margins indicate:
This metric separates businesses with durable advantages from commodity players in a race to the bottom. What to look for:
Trend matters: Improving gross margins over time signal growing pricing power. Declining margins suggest increasing competition or cost pressures. The rule: Companies with high gross margins have more room to invest in R&D, marketing, and innovation—which compounds their advantages over time. How These Metrics Work TogetherHere’s where it gets powerful: these five metrics don’t work in isolation. They validate each other. A great company typically shows:
Red flags emerge when metrics conflict:
The metrics tell a story together. Your job is to listen. Put It Into Practice: Your 3-Step Analysis FrameworkNow that you understand the metrics, here’s how to use them systematically when analyzing any stock: Step 1: Calculate the Core FivePull up the company’s latest 10-Q or 10-K from sec.gov. Find these line items:
Calculate all five metrics. Write them down. Step 2: Compare Against History and PeersDon’t analyze metrics in a vacuum. Ask:
Use free tools like FinBox, GuruFocus, or even the company’s own investor presentations for peer comparisons. Step 3: Connect the DotsLook for the story the metrics tell together:
Your decision framework:
Your Action ItemsHere’s what to do right now: 1. Pick a stock you own or are considering 2. Pull up their latest SEC filing (10-Q for quarterly, 10-K for annual) 3. Calculate these five metrics:
4. Compare to:
5. Ask yourself: Do these metrics support or contradict my investment thesis? Spend 30 minutes on this exercise. I guarantee you’ll learn more about your investment than reading a dozen analyst reports. A Real Example: Analyzing MicrosoftWant to see exactly how these metrics work in practice? Below, I walk through Microsoft’s Q1 FY2025 numbers from their latest SEC filing—showing you step-by-step how to calculate each metric, what the numbers reveal, and what red flags (or green lights) to look for... Continue reading this post for free in the Substack app
|
Wednesday, January 7, 2026
The 5 Financial Metrics That Matter Most (and Why) Visualized






Subscribe to:
Post Comments (Atom)
No comments:
Post a Comment