You’ve learned the basics of financial statement analysis. You can calculate a P/E ratio in your sleep. But here’s the challenge most intermediate investors face: knowing what numbers to look at doesn’t tell you whether you’re analyzing a great business or just a mediocre one with decent financials. The difference between a good investment and a great one often comes down to business quality, and business quality isn’t just about the numbers on a balance sheet. It’s about competitive positioning, scalability, management competence, and resilience. I’ve analyzed hundreds of companies over 13 years of investing, and I’ve distilled what separates exceptional businesses from the rest into 10 essential questions. These aren’t theoretical exercises, they’re practical filters you can apply to any company in under an hour. We’ll use Mastercard (MA) as our running example because it’s a business quality masterclass. By the end, you’ll have a reusable framework for evaluating any company in your portfolio or watchlist. [Visual suggestion: Hero image showing a checklist graphic with “10 Questions” prominently displayed, using blue/teal color scheme with orange accents for emphasis] The Framework: Three Pillars of Business QualityBefore we dive into the questions, understand that exceptional businesses excel across three dimensions:
Let’s examine each question with Mastercard as our guide. PILLAR 1: Competitive AdvantagesQuestion 1: Does the Business Have Pricing Power?Why it matters: Pricing power is the ultimate test of a moat. If a company can raise prices without losing customers, it’s not competing primarily on price; it’s delivering unique value. How to assess it:
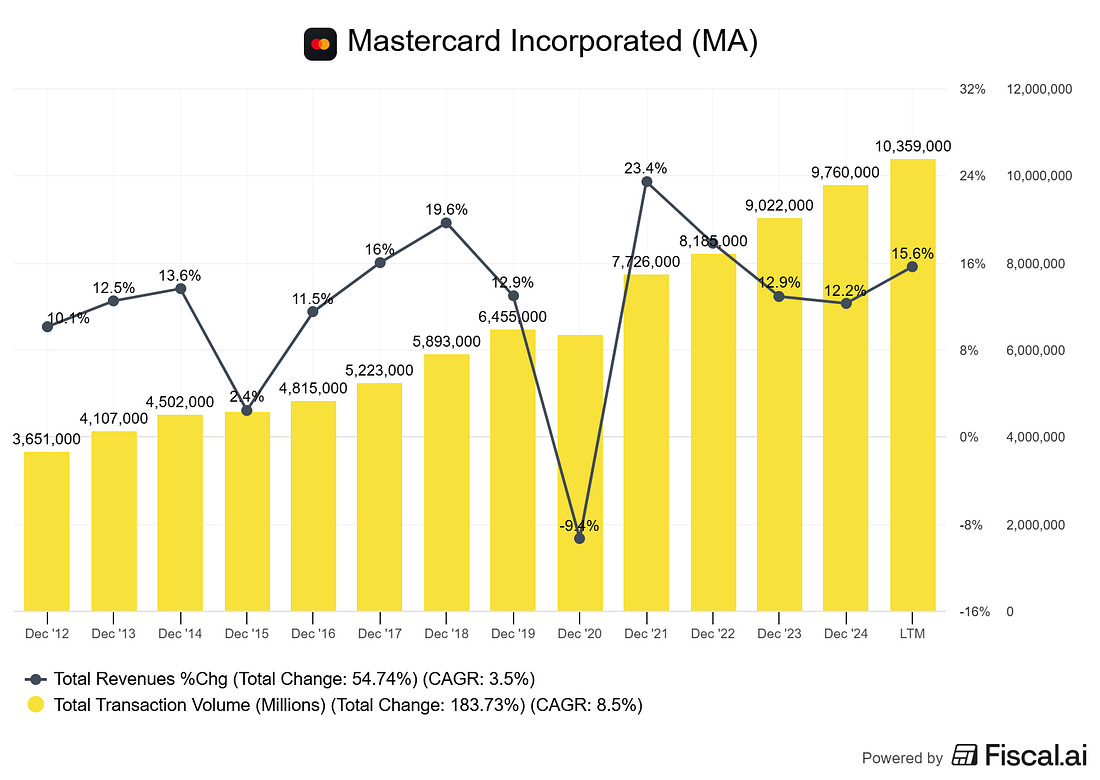
Mastercard example: Mastercard demonstrates clear pricing power. In 2024, gross dollar volume grew 11% (on a local currency basis) while net revenue grew 13% on a currency-neutral basis. This 2-percentage-point gap between volume and revenue growth indicates successful pricing improvements and revenue optimization. The company maintained this pricing discipline even as it processed 159.4 billion switched transactions globally, an 11% increase year-over-year. What good looks like: Consistent ability to raise prices 2-5% annually without volume declines. What bad looks like: Revenue growing more slowly than units sold, or an aggressive competitor's pricing forcing discounts.
Question 2: Are Customers Sticky? What Are the Switching Costs?Why it matters: Customer retention is cheaper than acquisition. High switching costs mean predictable revenue and pricing power. How to assess it:
Mastercard example: Mastercard doesn’t sell to consumers; it serves financial institutions. Once a bank issues Mastercard-branded cards, switching to Visa requires:
The result? Banks rarely switch networks. Mastercard had 3.5 billion cards issued globally as of December 2024, and major issuer relationships are exceptionally stable. What good looks like: Customer retention >95%, contracts >3 years, or mission-critical integration. What bad looks like: Annual contracts, easy product substitution, high churn rates. Question 3: Is the Moat Widening or Narrowing?Why it matters: A static moat eventually erodes. The best businesses strengthen their advantages over time through network effects, scale economies, or data accumulation. How to assess it:
Mastercard example: Mastercard’s network effect strengthens annually. More cardholders attract more merchants. More merchants attract more cardholders. Their global acceptance network now spans approximately 150 million merchant locations. Meanwhile, they’re layering on new moats:
What good looks like: Market share gains, increasing product stickiness, expanding into adjacent services. What bad looks like: market-share erosion, new entrants capturing growth, and defensive pricing.
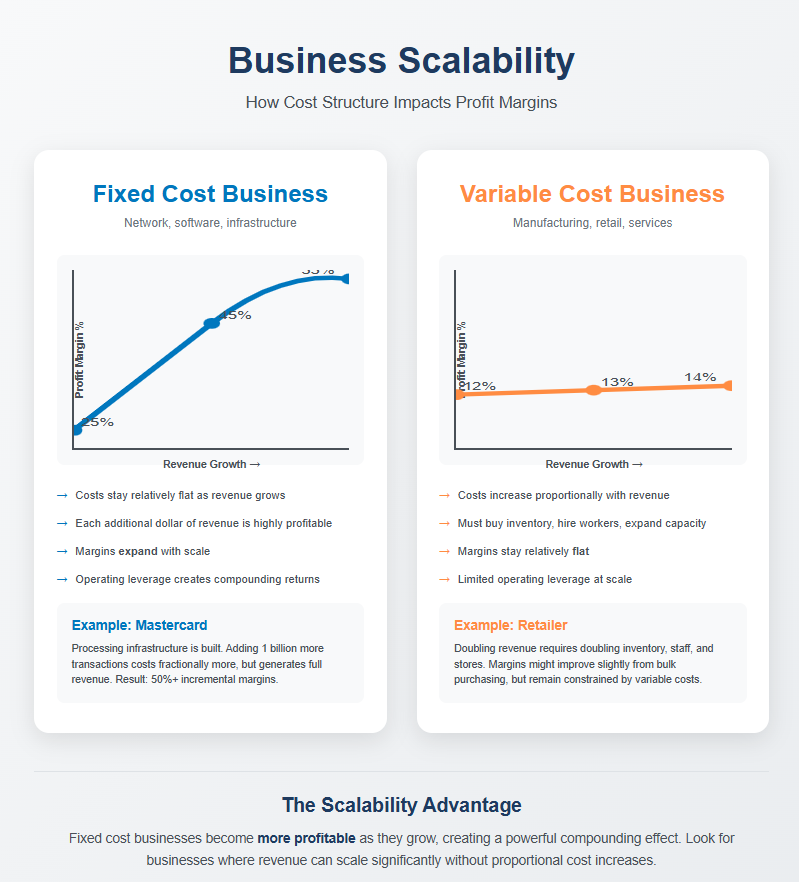
PILLAR 2: Economic CharacteristicsQuestion 4: Can the Business Scale Without Proportional Cost Increases?Why it matters: Scalability determines the trajectory of profit margins. The best businesses have high incremental margins—each new dollar of revenue is more profitable than the last. How to assess it:
Mastercard example: Mastercard’s network infrastructure is largely fixed cost in nature. In 2024:
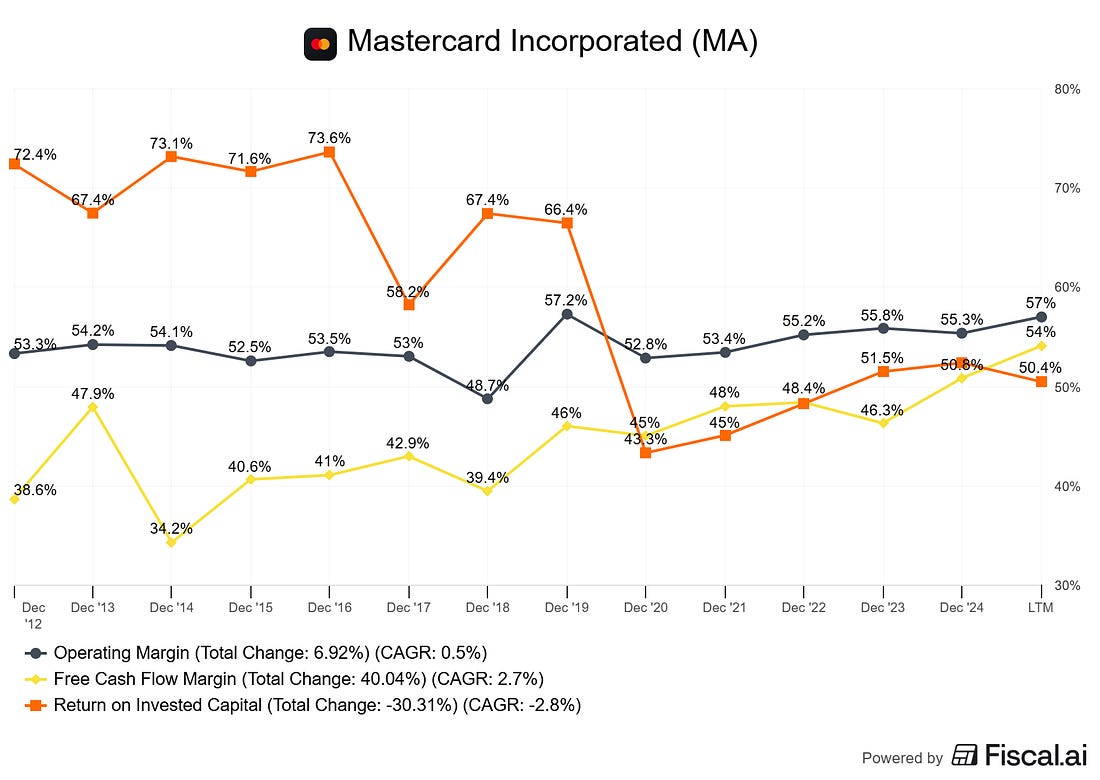
Operating margin remained stable at approximately 55-56% despite significant investments in technology and new capabilities, demonstrating exceptional scalability. What good looks like: Incremental margins >50%, expanding operating margins during growth. What bad looks like: Margins flat or declining with growth, high variable costs.
━━━━━━━━━━━━━━━━━━━━━━━━━━━━━━━━━━━━━━━━━━━━━━ You’ve just learned how to evaluate competitive advantages, the foundation of business quality analysis. But competitive advantages alone don’t tell the complete story. The next five questions reveal where most investors miss critical red flags: 📊 Pillar 2: Economic Characteristics → The scalability test that separates compounders from pretenders → Why Mastercard’s 52% incremental margins matter more than revenue growth → How to spot the customer concentration risk that killed [insert example] → The ROIC threshold that reveals true capital efficiency 🛡️ Pillar 3: Resilience & Adaptation → The capital allocation patterns that signal exceptional management → How to identify existential threats before the market does → Real examples of adaptability (and catastrophic failures to adapt) Plus: Get the one-page printable checklist to analyze any company in 15 minutes, formated for printing or digital use. Join 17,000+ investors who get my weekly deep dives on all things investing and finance... Continue reading this post for free in the Substack app
|
Monday, January 5, 2026
The 10-Question Business Quality Checklist Every Investor Needs






Subscribe to:
Post Comments (Atom)
No comments:
Post a Comment