Most investors lose money not from bad analysis but from invisible biases baked into their valuation models. You anchor to a historical multiple that no longer applies. You drift terminal assumptions upward to justify today’s price. You let multiple creep turn a 15× business into a 30× “story” without evidence. Today’s article shows you how to spot these three cognitive traps in your own work, using ASML’s 10-year re-rating as a cautionary tale of when premium valuations make sense, and when they don’t. TL;DR
Why It Matters
Valuation models are only as good as their inputs. Yet most errors don’t come from bad math; they come from cognitive biases that warp your assumptions without you noticing. You build a DCF, tinker with growth rates, and land on a fair value that feels right. What you don’t see is that you’ve unconsciously anchored to last year’s multiple, drifted your terminal value upward by 2% to make the price work, or let multiple creep turn a quality compounder into a speculative bet. Base rates tell the story. Research by McKinsey shows that terminal value represents 70–80% of DCF outputs for high-growth firms. A 1% change in perpetuity growth or discount rate can swing fair value by 20–30%. Yet investors rarely stress-test these assumptions. Instead, they anchor to recent trading ranges (recency bias), extrapolate current momentum into perpetuity (terminal drift), or justify today’s price by comparing it to other expensive stocks (multiple creep). The result? Overpaying for quality and underperforming for years while waiting for fundamentals to catch up. Where investors go wrong: They confuse price with value. A stock trading at 35× FCF can be cheap if ROIC is 40% with a decade of reinvestment runway. But if you’re paying 35× for a 20% ROIC business with slowing growth, you’ve let narrative override evidence. Core Concepts: The Psychology of ValuationAnchoring: The Historical Multiple TrapAnchoring is the tendency to rely too heavily on the first piece of information you encounter. In valuation, this manifests as fixating on historical multiples; whatever the stock traded at in 2020 becomes your mental “fair value” in 2024. If Adobe traded at 20× FCF in 2021, your brain defaults to that anchor even if the business has deteriorated (slower growth, rising costs, margin pressure). Quality investing check: Ask whether the business today deserves the same multiple it commanded five years ago. Has ROIC increased? Has the reinvestment runway extended? If not, the old anchor is obsolete. Historical averages are useful context, not gospel. Terminal Drift: The Perpetuity Creep You Don’t NoticeTerminal drift occurs when you slowly, unconsciously inflate your perpetuity growth rate or terminal multiple to justify a higher price. You start with 3% terminal growth (in line with GDP), then bump it to 3.5% because “this company has pricing power,” then to 4% because “management is exceptional.” Each adjustment feels reasonable in isolation. Cumulatively, they add 30–50% to fair value with no incremental evidence. Evidence-based discipline: Lock your terminal growth rate to GDP growth (2–3% real) unless you can prove the company will gain share in perpetuity. Share gainers are rare. Even Amazon, Microsoft, and Visa face saturation. If your model assumes perpetual share gains, you’re drifting. Multiple Creep: From Evidence to StoryMultiple creep happens when you compare a stock to peers trading at inflated valuations, then justify your own inflated price. If Snowflake trades at 15× sales and your SaaS compounder trades at 10×, you might argue it’s “cheap on a relative basis.” But if both are overvalued, you’ve just anchored to a bubble. Multiple creep also emerges when you let narratives (”AI will change everything”) override unit economics. ROIC vs WACC reality check: A business earning 25% ROIC with a 10% WACC deserves a premium multiple—perhaps 25–30× FCF if growth is strong. But a business earning 18% ROIC with a 9% WACC at 40× FCF is priced for perfection. The spread (ROIC – WACC) must justify the multiple. If it doesn’t, you’re paying for a story, not fundamentals.
Valuation Frameworks for Quality InvestorsReverse DCF: Start with today’s price and back-solve for the growth and margins required to justify it. This forces you to articulate whether those assumptions are realistic given the company’s history and competitive position. If the implied growth is 15% for 10 years and the company has averaged 8%, you’re either betting on a structural shift (prove it) or overpaying (admit it). Scenario design: Build three cases:
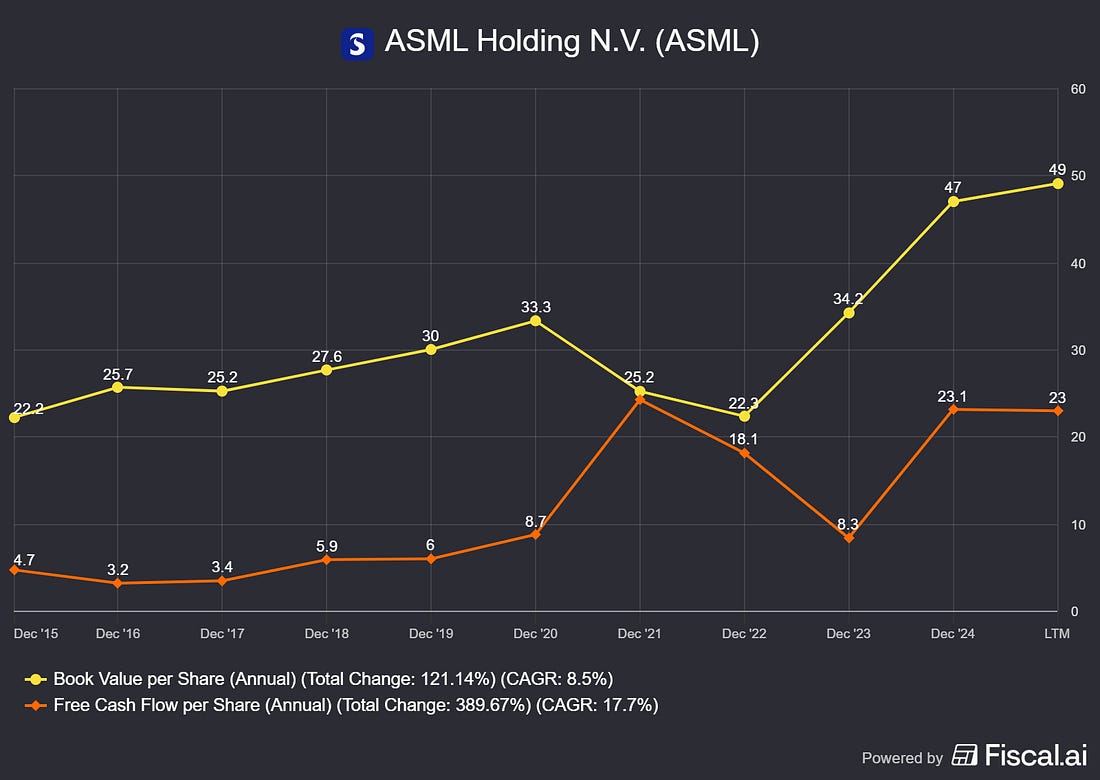
With different terminal multiples and growth paths. Weight them by probability (e.g., 30% / 50% / 20%). This prevents you from anchoring to a single “most likely” outcome and forces you to consider downside risks. Per-share framing: Always check FCF per share and book value per share over 5–10 years. If FCF/share is growing slower than the stock price, you’re paying up for multiple expansion, not business performance. That’s a red flag unless ROIC is improving materially. Capital allocation scorecard: Evaluate management’s track record on buybacks, M&A, and capex discipline. Companies that buy back stock at 10× FCF add value. Companies that buy back stock at 40× FCF destroy value. Yet multiple creep makes the latter look acceptable if peers are even more expensive.
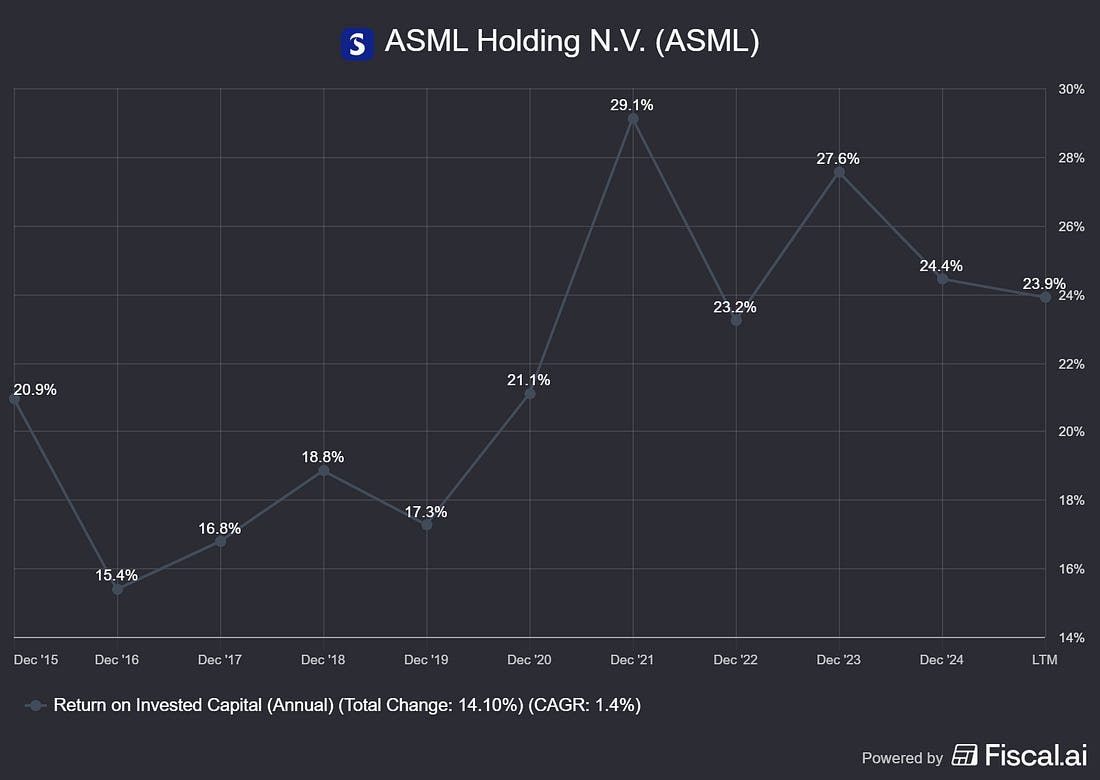
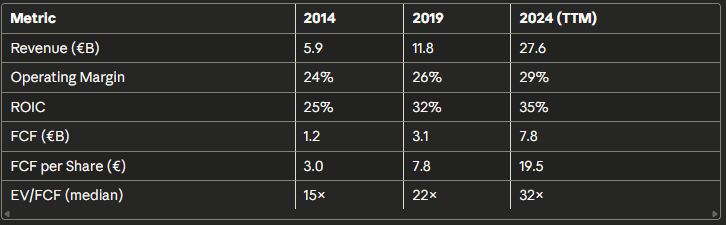
Worked Example: ASML’s 10-Year Re-RatingCompany context: ASML is the Dutch monopoly in extreme ultraviolet (EUV) lithography systems, which are essential for cutting-edge semiconductor manufacturing. It’s a textbook quality compounder: high ROIC (30–40%), strong FCF conversion (80–90% of net income), and a durable moat (20+ years of R&D lead, no credible competitors). As of Q3 2024, ASML trades at roughly €700 per share, up from €60 in 2014, a 10× gain in a decade. The re-rating story: In 2014, ASML traded at 15× trailing FCF. By 2024, it trades at 30–35× forward FCF. That’s a doubling of the valuation multiple. Was this justified? Partially. ASML’s ROIC improved from 25% to 35%+ as EUV systems scaled. Its reinvestment runway extended as AI and advanced nodes drove demand. But multiple expansion also reflects market exuberance: semiconductor equipment stocks benefited from the “picks and shovels” narrative around AI. Anchoring in action: An investor anchored to the 2016 multiple (18× FCF) might have missed the re-rating and sold too early. But an investor anchored to the 2021 peak (40× FCF, during the chip boom) might overpay today if they assume that valuation is the new normal. Terminal drift example: Let’s say you built a DCF in 2020 with 3% terminal growth. By 2023, you’ve bumped it to 4% because “semiconductor content is growing faster than GDP.” Then to 4.5% because “ASML has pricing power in EUV upgrades.” Each step feels incremental. Cumulatively, you’ve added 25% to fair value. Multiple creep example: In 2021, investors compared ASML to Applied Materials (trading at 25× FCF) and Lam Research (22× FCF) and concluded ASML at 38× was “reasonable for the quality leader.” But if all three were overvalued, relative cheapness was irrelevant. Today, ASML at 32× FCF looks cheaper than 2021, but that’s anchoring to a bubble.
The Numbers: 10-Year Trends
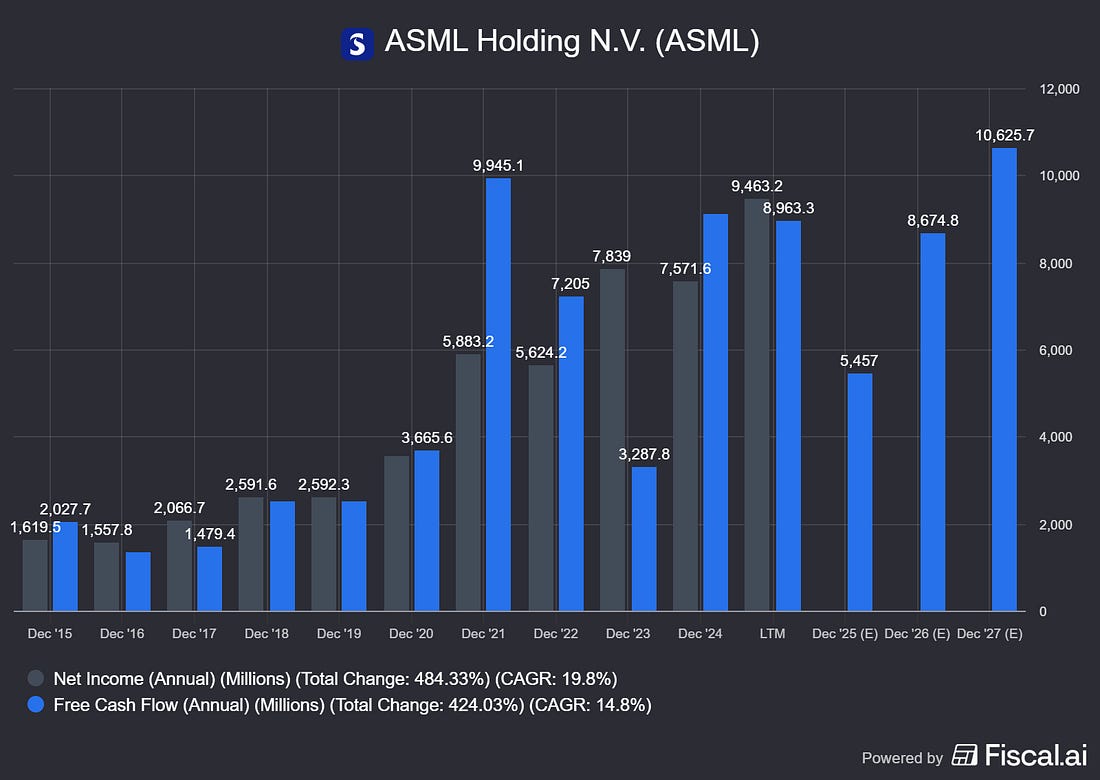
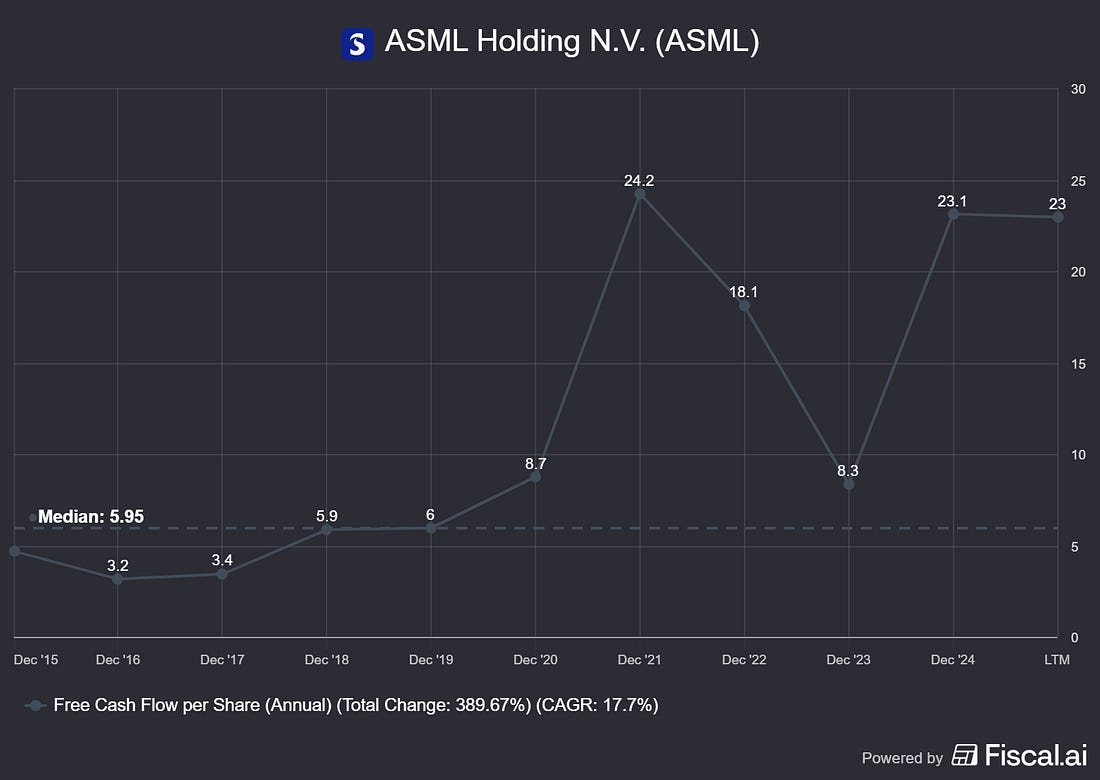
Sources: ASML 20-F filings, company investor relations, Bloomberg. As of Q3 2024. Evidence-based interpretation: ASML’s ROIC expansion and FCF/share growth justify some multiple expansion, perhaps from 15× to 22–25×, as the business has proven its durability. But the jump to 32× in 2024 reflects terminal drift (investors assuming perpetual share gains in a concentrated market) and multiple creep (AI narrative pushing all chip stocks higher). A reverse DCF at 32× FCF implies 10% annual FCF growth for the next decade. ASML’s 2014–2024 CAGR was 18%, but that included the EUV ramp. Mature EUV sales will slow. Is 10% realistic? Maybe. Is it guaranteed? No. Alternative interpretation: Some bulls argue ASML deserves 35–40× FCF because it’s a monopoly with no substitutes. This assumes (1) geopolitical stability (China restrictions don’t escalate), (2) sustained node shrinks (Moore’s Law doesn’t plateau), and (3) no technological disruption (no alternative to EUV emerges). If all three hold, 35× might be fair. But you’re betting on three uncertain outcomes. That’s terminal drift masquerading as “high conviction.”
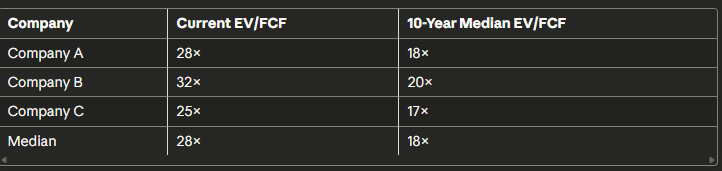
How to Do This YourselfStep 1: Build a Reverse DCF FirstBefore you build a forward DCF, back-solve from today’s price. Use a standard WACC (8–10% for quality firms) and see what growth rate is implied by the current valuation. If the market is pricing in 12% FCF growth for 10 years and the company has averaged 6%, ask yourself: What structural change justifies doubling the growth rate? Data to gather: Pull 10 years of FCF, net income, and shares outstanding from the company’s 10-K/20-F. Calculate FCF/share growth (not just absolute FCF, buybacks matter). Compare to revenue and earnings growth. If FCF/share is lagging, buybacks or dilution are distorting the picture. Decision rule: If implied growth exceeds historical growth by more than 3–5 percentage points, write a 2-paragraph memo explaining why. If you can’t, you’re paying for terminal drift. Step 2: Lock Your Terminal Assumptions and Justify Any IncreaseSet terminal growth at GDP (2.5–3.0% nominal for developed markets). Do not adjust unless you can prove perpetual share gains. Even Microsoft and Google eventually face saturation. Lock your terminal ROIC at the company’s 10-year median, don’t assume ROIC improvement into perpetuity unless there’s a clear catalyst (e.g., scale economies kicking in at higher volumes). Where to find data: Use the company’s segment disclosures (10-K) to estimate mid-cycle margins. For ROIC, calculate NOPAT / (Net Working Capital + Net Fixed Assets). Exclude goodwill unless it’s a serial acquirer, in which case it reflects real IP. Red flag: If your terminal growth rate is above 3.5% or your terminal ROIC exceeds the 10-year median by more than 2 percentage points, you’re drifting. Reset to the base case and see if the stock is still attractive. If not, pass. Step 3: Run a Peer Multiple Check—But Reverse ItInstead of asking “Is my stock cheap relative to peers?”, ask “Are my peers overvalued?” Pull EV/FCF and EV/EBIT for 5 comparable companies. Calculate the median. Then check if the median itself is above the 10-year historical median. If yes, the whole sector is expensive. Buying the “cheapest” expensive stock is still buying an expensive stock. Data sources: Screeners like FinViz or Fiscal.ai for multiples. Company filings for historical ranges. Set up a simple table:
If the current median is 50%+ above the historical median, you’re in multiple creep territory. Adjust your fair value downward to reflect mean reversion risk. Step 4: Stress-Test with ScenariosBuild three scenarios with different terminal multiples and growth paths:
Weight by probability (e.g., 30% / 50% / 20%) to get a probability-weighted fair value. This prevents anchoring to a single outcome and forces you to quantify downside risk. Step 5: Check Per-Share Metrics and Capital AllocationPull FCF/share, book value/share, and EPS/share over 10 years. If the stock has risen 15% annually but FCF/share has grown only 8%, the gap is multiple expansion. That’s not necessarily bad; quality businesses do re-rate, but you’re paying for sentiment, not cash flow. If multiples mean-revert, you’ll underperform. Capital allocation scorecard: Did management buy back stock at reasonable valuations (15–20× FCF) or did they buy back at 40×? The former adds value; the latter destroys it. Check the 10-K for repurchase prices. If management bought back heavily at peak multiples, that’s a red flag for future returns. Pitfalls and False PositivesConfusing quality with price: A 40% ROIC business can still be expensive. Quality earns you the right to pay a premium—not to pay any price. If ROIC is 40% but you’re paying 50× FCF, you’re betting on perpetual multiple expansion. That’s speculation, not investing. Relative valuation traps: Saying “Company A is cheaper than Company B” is meaningless if both are overvalued. Always check absolute valuation (EV/FCF vs 10-year range) before making relative comparisons. Narratives over numbers: The most dangerous form of multiple creep is when you let a story (”AI will change everything”) override unit economics. Stories are seductive. Math is boring. But math is also accurate. If the business can’t generate the cash flows implied by the valuation, the story doesn’t matter. Ignoring cyclicality: Many quality businesses are still cyclical (semiconductors, industrial software). If you build a DCF at peak margins, you’re anchoring to an unsustainable starting point. Normalize for mid-cycle margins before projecting forward. Over-weighting recent data: Using a 3-year average multiple instead of a 10-year average anchors you to recent momentum. If the last three years were a bull market, your “average” is inflated. Use the full cycle. Checklist
Glossary
Further Reading
Disclaimer: This article is for educational purposes only and does not constitute investment advice. Always conduct your own research and consult with a financial advisor before making investment decisions. You're currently a free subscriber to School of Investing. For the full experience, upgrade your subscription.
|
Saturday, December 6, 2025
Valuation Pitfalls: How Anchoring, Terminal Drift, and Multiple Creep Destroy Returns







Subscribe to:
Post Comments (Atom)
No comments:
Post a Comment