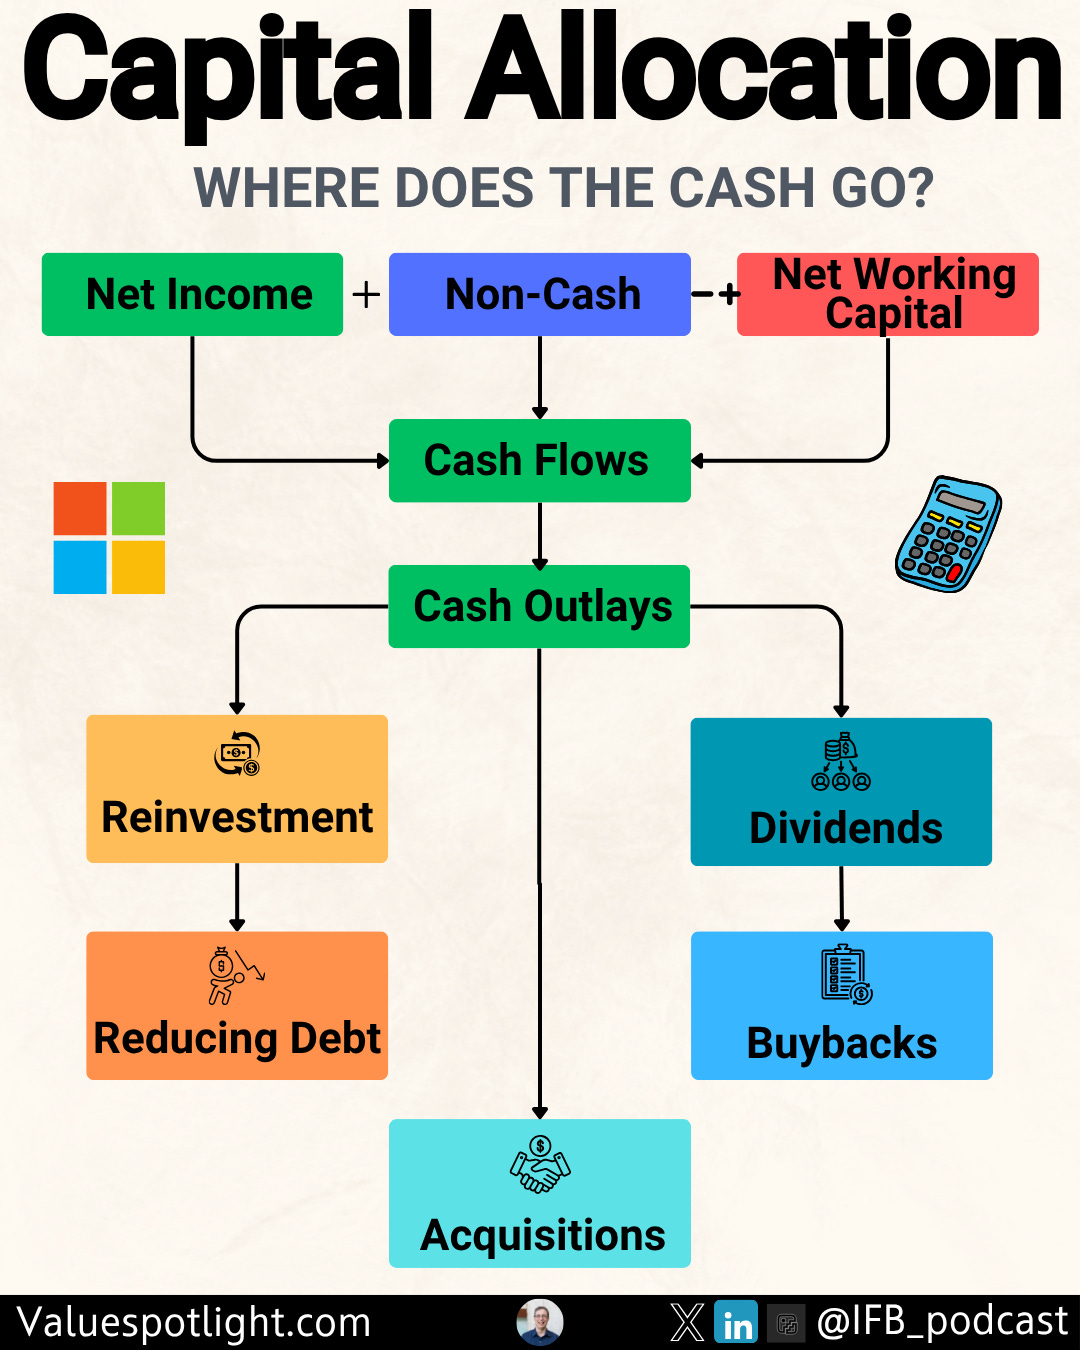
| Most investors debate buybacks versus dividends. Quality investors ask a different question: What’s the highest-return use of the next marginal dollar? Today’s article gives you a visual, decision-first “Meta Capital Allocation Scorecard” that ranks uses of cash by their contribution to durable, per-share compounding—and shows you how to apply it to a real company. Capital allocation should follow a hierarchy: high-ROIC organic reinvestment first; then disciplined bolt-ons; then buybacks when undervalued; then dividends; debt paydown is situational. Always anchor on ROIC versus WACC. Sustained ROIC – WACC > 5% with reinvestment capacity is the core engine of value creation. Per-share framing matters: track FCF/share, EPS, and share count. A shrinking share count at attractive valuations multiplies compounding. Check FCF conversion and working capital discipline; cash pays bills, not GAAP earnings. Use a scorecard to rank each dollar of cash across uses; update it annually with clear thresholds and hurdle rates.
Capital allocation is the CEO’s most repeatable edge. Over a decade, your return largely mirrors management’s ability to: Earn returns above the cost of capital. Reinvest at those attractive returns. Return surplus cash intelligently when reinvestment is constrained.
Where investors go wrong: Treating buybacks as universally good (they’re only good below intrinsic value). Confusing growth with value creation (growth below WACC destroys value). Ignoring per-share math (EPS/FCF per share vs absolute totals). Overlooking working capital needs that drain cash despite reported profits.
Base rates to remember: Most companies struggle to sustain ROIC materially above WACC; those that do often have identifiable moats and disciplined capital allocation. Buybacks at peak multiples have historically underperformed; buybacks during periods of undervaluation add the most per-share value. Capital-light, subscription-like models often show high cash conversion and stable moats—ideal habitats for quality compounding.
ROIC (return on invested capital) is the after-tax operating profit generated per dollar of capital invested. WACC (weighted average cost of capital) is the blended cost of debt and equity capital. Spread: ROIC – WACC. Positive and sustained spreads create value; negative spreads destroy it.
Light math: Decision rule: Signals of a long runway: Large TAM with low penetration, pricing power, product breadth, and clear adjacencies. Efficient capacity additions with attractive incremental returns.
Unit economics: gross margin structure, customer acquisition cost (CAC), retention/churn, LTV/CAC where applicable. Per-share framing: focus on FCF/share, EPS, and share count. SBC (stock-based comp) should be normalized into per-share economics.
Decision rules: FCF conversion (FCF/Net Income) > 90% over a cycle is excellent for mature, capital-light businesses. Progressive reduction in share count at or below intrinsic value is additive; rising share count via SBC requires higher growth to offset dilution.
Evidence beats narrative: look for pricing power (stable or rising gross margin), retention (low churn, multi-year contracts), and switching costs (embedded workflows, data network effects). Stability across cycles: margin bands that narrow or rise over time indicate durable moats.
This is the backbone of the article. Use it to rank each incremental dollar. Organic reinvestment (highest priority)
R&D in core products; capacity expansion; go-to-market. Hurdle: post-tax ROIC ≥ 1.3× WACC in steady state (e.g., ≥ 10% if WACC ~7–8%).
Bolt-on M&A (second)
Buybacks (conditional)
Only when intrinsic value estimate ≥ market price margin-of-safety (e.g., ≥ 15%). Funded from surplus FCF after reinvestment and balance sheet guardrails.
Dividends (progressive policy)
Balance sheet (always-on guardrails)
Target net debt/EBITDA that protects flexibility (e.g., 1.5–2.0× for stable cash generators). Maintain ample interest coverage.
RELX is a global provider of information-based analytics and decision tools across scientific, legal, risk, and events. It’s a classic quality, capital-light compounder with subscription revenue and strong cash conversion. What the numbers say (as of FY2023): ROIC: 14.0% (adjusted definition in company materials) (RELX 2023 Annual Report, p. 2; as of FY2023). Adjusted operating margin: 33.1% (up from 31.4% in 2022) (same source; as of FY2023). Adjusted cash flow conversion: 98% (2023) (same source; as of FY2023). Capital expenditure: ~5% of revenues (divulged in RELX reporting) (RELX 2023 Annual Report, as of FY2023). Shareholder distributions: £800m buybacks in 2023; plan for £1,000m in 2024; dividend +8% to 58.8p (FT RNS/Results 2023, as of Feb 15, 2024). Balance sheet: net debt/EBITDA ~2.0× (as of year-end 2023) (same FT RNS; as of FY2023).
Interpretation (quality lens): ROIC > WACC by an estimated 6–7 pts suggests robust value creation. High cash conversion supports both reinvestment and returns of capital. Capital intensity is modest; incremental growth relies more on R&D and product expansion than on heavy capex. Buybacks appear disciplined and consistent, layered on top of reinvestment and dividend growth.
Caveats: “Adjusted” metrics differ from GAAP; investors should reconcile adjustments to understand normalized economics. WACC is estimated; use your own inputs by region, rate environment, and beta. Exhibitions segment has cyclicality; focus on blended margins and cash conversion across the cycle.
Step 1: Gather data (primary sources preferred) Filings: Annual report/20-F, investor presentations, results releases (e.g., RELX 2023 Annual Report; FT RNS/Results 2023). Financials: Revenue, operating profit, NOPAT, invested capital, capex, working capital, FCF, share count, SBC, buyback/dividend history, net debt/EBITDA. Segment mix and qualitative moat drivers.
Step 2: Calculate core checks ROIC: NOPAT / average invested capital over the period. WACC: Use your inputs for risk-free rate, market risk premium, beta, and after-tax cost of debt. FCF conversion: FCF / Net Income. Also track FCF margin: FCF / Revenue. Per-share metrics: FCF/share, EPS, share count trend; adjust for SBC if material. Working capital: DSO, DIO, DPO; compute CCC = DSO + DIO – DPO.
Step 3: Build the Meta Scorecard For each use of cash, score 0–5 on: Return vs hurdle (post-tax ROIC vs WACC). Strategic fit/moat strengthening. Timing/optionality (is this reversible?). Balance sheet impact (leverage after action). Valuation (for buybacks/M&A).
Rank by total score. The top-ranked use gets the next marginal dollar.
Step 4: Decision rules and thresholds Organic reinvestment: greenlight if modeled post-tax ROIC ≥ 10–12% (assumes 7–8% WACC). Bolt-on M&A: require credible path to post-tax ROIC > WACC by year 2–3; cap deal size to maintain ≤ 2.0× net debt/EBITDA for stable cash generators. Buybacks: require ≥ 15% discount to intrinsic value (reverse DCF/owner earnings) and room under leverage guardrails. Dividends: target a progressive policy covered by through-cycle FCF. Balance sheet: set floor for interest coverage (e.g., > 8×) and ceiling for net debt/EBITDA (e.g., ≤ 2.0× for non-cyclical businesses).
Step 5: Monitor and update annually Buybacks at any price: Accretive only below intrinsic value. Buying back at peak multiples shrinks flexibility and destroys per-share value. Growth-for-growth’s sake: Expanding capital employed at returns near WACC erodes value even if revenue grows. Ignoring working capital: Rapid growth that lengthens DSO or builds inventory can crush FCF despite solid earnings. Over-reliance on “adjusted” metrics: Always reconcile GAAP to adjusted numbers; understand recurring vs truly one-off items. Dividend traps: Overcommitting to payouts in businesses with high reinvestment needs or cyclicality.
ROIC – WACC > 5% sustained? Yes/No Reinvestment runway (3–5+ years) with stable/increasing margins? Yes/No FCF conversion > 90% through-cycle? Yes/No Per-share metrics trending up; share count stable/down; SBC < 5% revenue? Yes/No Balance sheet within guardrails (Net debt/EBITDA ≤ 2.0×; high interest coverage)? Yes/No Buybacks only below intrinsic value and after organic/M&A needs? Yes/No Dividend covered by through-cycle FCF and flexible? Yes/No M&A policy favors bolt-ons with clear, measured post-tax ROIC > WACC in 2–3 years? Yes/No
How do I estimate WACC quickly?
Use a reasonable range: risk-free rate (10-year government), market risk premium, your beta estimate (sector/5-year), and after-tax cost of debt. Sensitize ±100–200 bps.
What if ROIC is high but reinvestment runway is short?
Are dividends ever superior to buybacks?
How do I judge buyback quality?
Check timing vs valuation, funding source (FCF vs debt), per-share outcome (EPS/FCF/share), and whether buybacks offset SBC or truly reduce share count.
What’s a good FCF conversion?
ROIC: Return on invested capital; NOPAT divided by invested capital. WACC: Weighted average cost of capital; blended cost of equity and debt. FCF: Free cash flow; cash from operations minus capex (and sometimes plus/minus working capital). FCF conversion: FCF divided by net income; a cash quality metric. SBC: Stock-based compensation; a non-cash expense that dilutes shareholders if not offset. CCC: Cash conversion cycle; days to convert inventory and receivables into cash, net of payables. Bolt-on M&A: Small acquisitions adjacent to the core, easier to integrate. Margin of safety: Discount between price and intrinsic value estimate.
Measuring the Moat (Mauboussin) — durable competitive advantage, 2013. Berkshire Hathaway Shareholder Letters — on capital allocation, ongoing. Aswath Damodaran — Cost of capital and valuation notes, updated annually. Credit Suisse (CSFB) — Global Investment Returns Yearbook (for base rates), annual.
RELX 2023 Annual Report (financial summary, ROIC 14.0%, adjusted cash flow conversion 98%, operating margin 33.1%, capex ~5% of revenue) — as of FY2023: RELX 2023 Annual Report. RELX 2023 Results Announcement (buybacks £800m in 2023; plan £1,000m in 2024; dividend +8%; net debt/EBITDA 2.0×; M&A pace) — as of Feb 15, 2024: Financial Times RNS: RELX 2023 Results. RELX press on publication of 2023 Annual Report — confirmation of filings — as of Feb 2024: RELX press release.
Educational content, not investment advice. You're currently a free subscriber to School of Investing. For the full experience, upgrade your subscription. Upgrade to paid | |





No comments:
Post a Comment