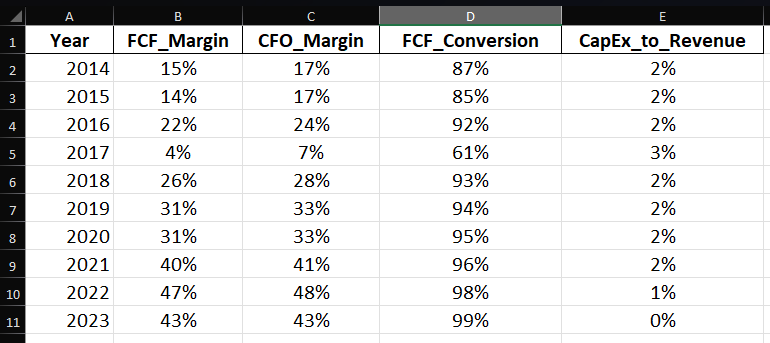
| S&P Global’s earnings durability is underpinned by a highly recurring, asset-light information-services model with diversified monetization across credit ratings, indices, data/analytics, and commodity insights. Structural moats include network effects (indices AUM-linked fees), brand and regulatory accreditation (NRSRO ratings), switching costs (embedded workflows, historical time series), and scale/data advantages. The largest swing factors are (1) ratings issuance cyclicality, (2) potential regulatory actions affecting take rates or methodology, and (3) competitive dynamics in data/analytics and index licensing. Durability Score: 88/100. It could rise with continued mix-shift to subscription/recurring revenues, broadened index AUM penetration, and stable regulatory posture; it could fall with prolonged issuance droughts or material regulatory/take-rate changes that compress margins. Recurring, high-margin model: Average CFO margin ~29% and FCF margin ~27% over a decade indicate strong cash generation relative to sales, consistent with subscription/data/rating franchises. Low CapEx intensity (~1.8% of revenue) supports robust cash conversion into FCF without heavy reinvestment needs. Capex-light durability: With limited PP&E investment required, growth has been funded primarily through operating cash. This structure typically scales well and cushions cash flows in down-cycles. FCF resilience and improvement: Despite a pronounced dip in 2017 (FCF margin ~4%), the company rebounded quickly, with FCF margins in the 25–47% range from 2018 onward. The step-up through 2021–2023, alongside revenue CAGR of ~7.7%, underscores durable cash profitability. Strong FCF conversion: Average FCF/CFO conversion of ~90% (using only CapEx) highlights minimal leakage from operating cash flows to sustain the asset base, amplifying cash available for debt service, buybacks, dividends, or selective M&A. Scale benefits and mix shift: From 2014 to 2023, revenue roughly doubled (4.27B → 8.30B), while FCF increased more than 5× (0.63B → 3.56B), implying expanding operating leverage and mix toward higher-value analytics/benchmarks. The 2022 integration period aligns with the visible step-up in both revenue and cash generation afterward. Volatility note: 2017 is the outlier year in this series. Excluding that year, both margins and FCF growth display a steadier trajectory, reinforcing the “durable earnings” characterization over the broader period.
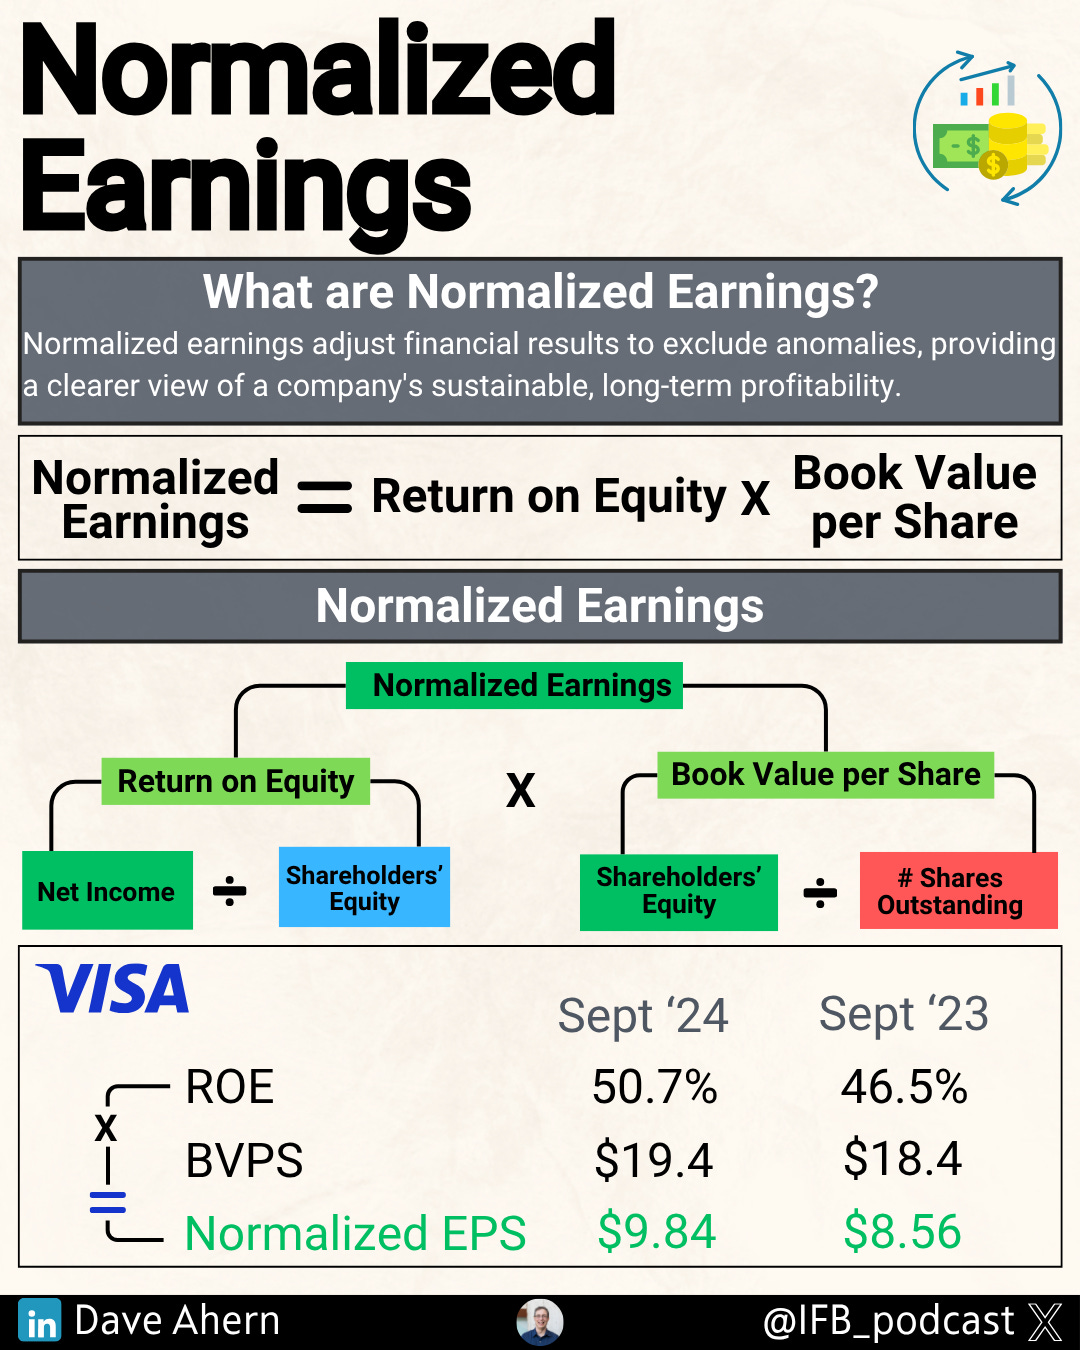
Higher ROIC + reinvestment → higher and longer growth g. Predictable cash flows and recurring mix → lower required return k. Stable-growth intuition: EP=(k−g)(1−b),b=retention rate What can expand/contract the multiple: Expanders: issuance up-cycle, recurring mix gains, AI/data monetization, benign regulation, lower real rates. Contractors: regulation/take-rate pressure, prolonged issuance drought, fee deflation in indices/data, higher rates.
Optional narrative (DCF/EVA):
TSR framework: TSR≈FCF/share growth+Dividend Yield+ΔMultiple Base case (qualitative assumptions): FCF/share growth: MSD-to-HSD from mix-shift to recurring + issuance normalization; modest margin expansion; ongoing buybacks reduce share count. Dividend yield: low current yield with steady annual raises; payout remains conservative versus FCF. Multiple: stable to modest compression if rates rise; expansion if durability narrative strengthens.
Bear case: Bull case: Sensitivity (qualitative):
Network effects and switching costs (15): 9 Pricing power (15): 9 Cyclicality and shock resilience (10): 7 Customer/supplier concentration (10): 9 Cash conversion and capital intensity (10): 9 ROIC level and fade risk (15): 9 Regulation risk (10): 6 Disruption risk (10): 7 Reinvestment runway (10): 8 Accounting quality (5): 8
Durability Score (0–100) = 88 Biggest drivers: network effects and brand/regulatory status in Ratings and Indices; asset-light cash conversion. What could move it ±10: Regulatory/take-rate actions (down), or accelerated recurring mix/AI-enabled productivity gains (up).
Core issuance/transaction trends vs market volumes; monthly Billed Issuance (as disclosed). Index AUM, ETF flows, licensing yields; new index launches. Subscription growth in Market Intelligence and Commodity Insights; attach and seat metrics. Margin trajectory (adjusted vs GAAP); cost discipline and synergy capture. FCF conversion; buybacks; share count; leverage. Regulatory developments (SEC/ESMA/FCA) and any notable cases. Key partnerships, renewals, and ecosystem integrations (ETF sponsors, exchanges). Guidance changes and variance analysis. Sources: quarterly earnings materials (see Quarterly Earnings hub) and 10-Qs.
Risks: Issuance cyclicality (medium likelihood/medium–high impact). Regulatory/take-rate changes (low–medium likelihood/high impact). Fee pressure in indices/data or share loss to competitors (medium/medium). Methodology/operational lapses (low/high due to reputational leverage).
Catalysts: Issuance rebound cycles; new index adoptions; major data contract wins. AI features that increase product differentiation and pricing. Portfolio optimization (value-accretive M&A/divestitures). Regulatory clarity or positive rulings.
Disclosures: Educational content. Not investment advice. You're currently a free subscriber to School of Investing. For the full experience, upgrade your subscription. Upgrade to paid | |





No comments:
Post a Comment