| Most retailers live and die by inventory. Costco turned it into a structural advantage. By pairing rapid turns with member-funded float, the company sustains high returns on invested capital and outsized cash generation, without needing a levered balance sheet or premium gross margins. This is a practical accounting case study on how to read inventory discipline and translate GAAP profit into owner earnings. Costco’s working-capital model is a moat element: fast turns, minimal receivables, and supplier financing keep invested capital low and ROIC high. Owner earnings reconcile from GAAP by adjusting for non-cash items, working capital, and maintenance capex; for Costco, FCF conversion is robust. The ROIC spread is wide compared to a typical retail WACC, driven by high capital turns rather than margin. Per-share framing matters: stable share count, periodic special dividends, and modest buybacks highlight a shareholder-friendly capital allocation record. Beware false positives: inventory “improvements” from stockouts, pulling payables forward, or deferring capex are not durable. You can replicate this analysis with 10-K data: compute DIO/DPO/DSO, CCC, ROIC (with clear definitions), and a GAAP→owner-earnings bridge.
In quality investing, durability beats drama. Durable compounding typically comes from: ROIC consistently above WACC Reinvestment runway with disciplined capital intensity Clean unit economics that convert to cash Per-share value creation, not just headline growth
Retail is often seen as commoditized. Costco demonstrates how a member model, operating discipline, and working capital design compound into real economic returns. Where investors go wrong: they focus on gross margins, not capital turns; net income, not cash; growth, not per-share economics. Base rate context: Mature, scaled retailers often run low single-digit operating margins. The winners drive high asset turns and supplier/customer float, compressing invested capital and elevating ROIC. Shareholder yield at quality retailers tends to come in periodic bursts (special dividends) and modest buybacks when shares are expensive, but a consistent base dividend.
ROIC measures returns on operating capital deployed. A simplified formula: ROIC = NOPAT / Invested Capital where WACC is the blended cost of debt and equity. For large, stable US staples retailers, a 7–8% range is a reasonable starting assumption; compute specifically if modeling. Value creation occurs when ROIC > WACC, sustained.
Costco grows via new warehouses, category expansion, and international. Capex adds capacity; unit economics decide whether added capital compounds value. Capital intensity matters: each new unit should pay back quickly and not drag CCC.
Measure membership fees (recurring, high-margin), warehouse-level returns, and FCF per share. Per-share framing filters out optical growth from issuance; track diluted shares, SBC, and buybacks.
Evidence for Costco: retention through membership renewal rates, stable margin bands, pricing power via everyday low prices, strong vendor relationships, scale advantage, and predictable inventory turns. Don’t rely on claims; look for multi-year margin stability, consistent turn efficiency, and renewal pace in filings.
Build bridges: GAAP net income → Owner earnings (a proxy for distributable cash after maintenance) Margin × Capital turns → ROIC (DuPont-style decomposition) Working capital cycle (DSO/DIO/DPO) → CCC and float
Company: Costco Wholesale (NASDAQ: COST), a US warehouse-club retailer with a membership model. Key FY2024 facts (as of Sep 1, 2024 per 10-K unless noted): Net sales: $249.6B; membership fees: $4.83B Costco FY2024 press release (as of Sep 26, 2024). Operating income: $9.29B; Net income: $7.37B; Diluted EPS: $16.56 Costco 10-K (as of Sep 1, 2024). Cash from operations: $11.34B; Capex: $4.71B; FCF (OCF–Capex): ~$6.63B (as of FY2024 10-K). Cash & equivalents: $9.91B; Total debt: ~$5.90B; Share count ~444.8M diluted 10-K. Special dividend paid Dec 2023 contributed to ~$9.04B total cash dividends in FY2024 [10-K cash flow statement] (as of FY2024). SBC: $818M [10-K cash flow statement] (as of FY2024).
Working capital discipline Inventories (ending): $18.65B; Accounts payable: $19.42B in FY2024 [10-K balance sheet]. Payables exceed inventories, indicating vendor financing. Receivables are minimal for a retailer, reflecting cash-like sales and co-brand credit arrangements.
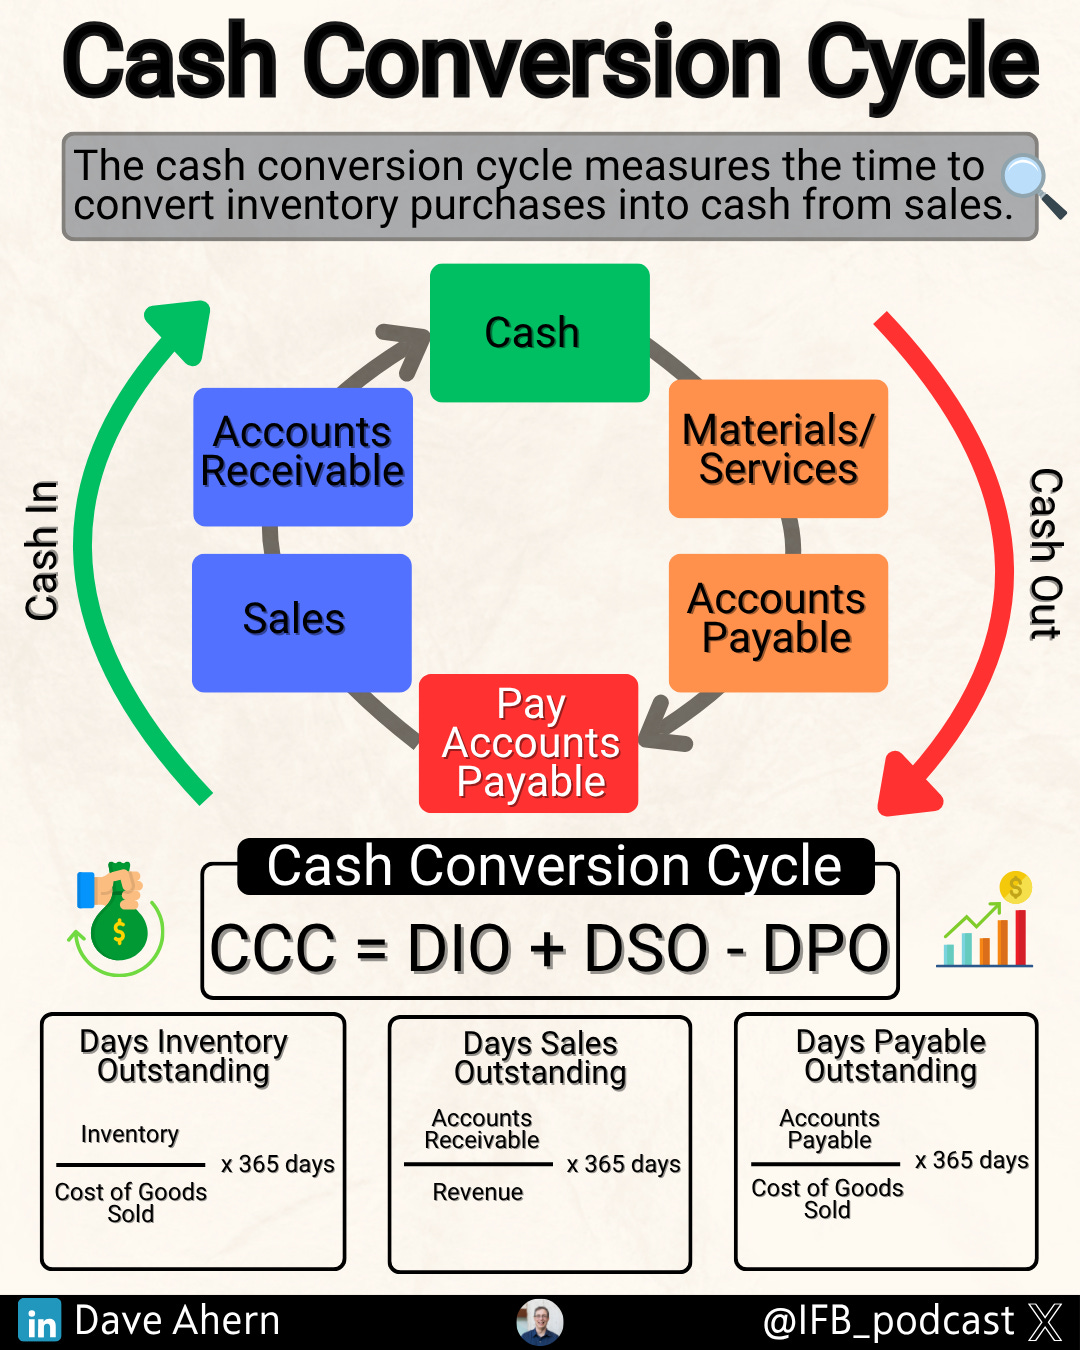
Compute the cash conversion cycle (CCC) using FY2024 data (approximate; seasonality applies): DIO: DIO ≈ Avg Inventory / COGS ×365 ≈ 222.36 17.65×365 ≈ 29 days DPO: DPO ≈ Avg A/P / COGS ×365 ≈ 222.36 18.45 ×365 ≈ 30 days DSO: DSO ≈ Avg AR / Sales ×365 ≈ 249.63 2.50 × 365 ≈ 3.7 days CCC: CCC ≈ DIO+DSO−DPO ≈ 29+3.7 − 30 ≈ 2 days
Interpretation: near-zero CCC (often slightly negative/positive depending on period) is a strength—it means the business is largely customer- and vendor-financed rather than equity/debt-financed. It supports high capital turns. ROIC snapshot (simplified) NOPAT (approx): operating income × (1 – effective tax rate). Invested capital (simplified): debt + equity – cash ROIC ≈ 7.0 / 18.7 ≈ ~37% (method varies; this is a common “net capital employed” proxy). If you include other operating liabilities, you can get even lower invested capital and higher ROIC; be consistent and transparent about the definition.
ROIC spread If you assume WACC ~7–8% for a large, low-beta US staples retailer, Costco’s ROIC spread is materially positive. This spread has been sustained over time, driven primarily by capital turns rather than margins.
Per-share framing and capital allocation Diluted shares were ~445M in FY2024, largely flat year over year [10-K]. Regular dividends plus periodic specials: FY2024 included a substantial special dividend (total cash dividends ~$9.04B) while free cash flow remained strong [10-K]. Buybacks were modest ($0.7B) in FY2024; management has historically favored specials when cash accumulates. SBC was $818M; watch dilution but note share count stability suggests offset via repurchases or limited issuance.
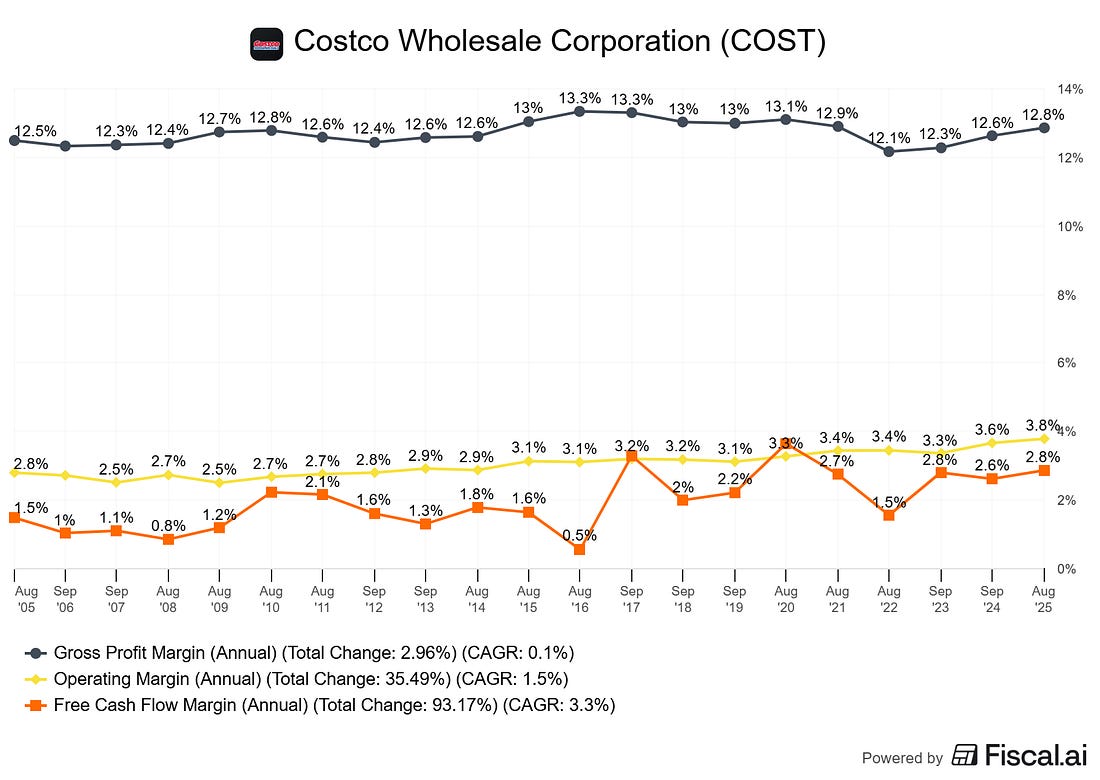
Margin bands Gross margin ~11%; operating margin ~3.7%; net margin ~3.0% in FY2024. Trend has improved modestly over the past 5–6 years despite cost pressures, which is notable for a scale retailer Macrotrends margin series (as of May 31, 2025).
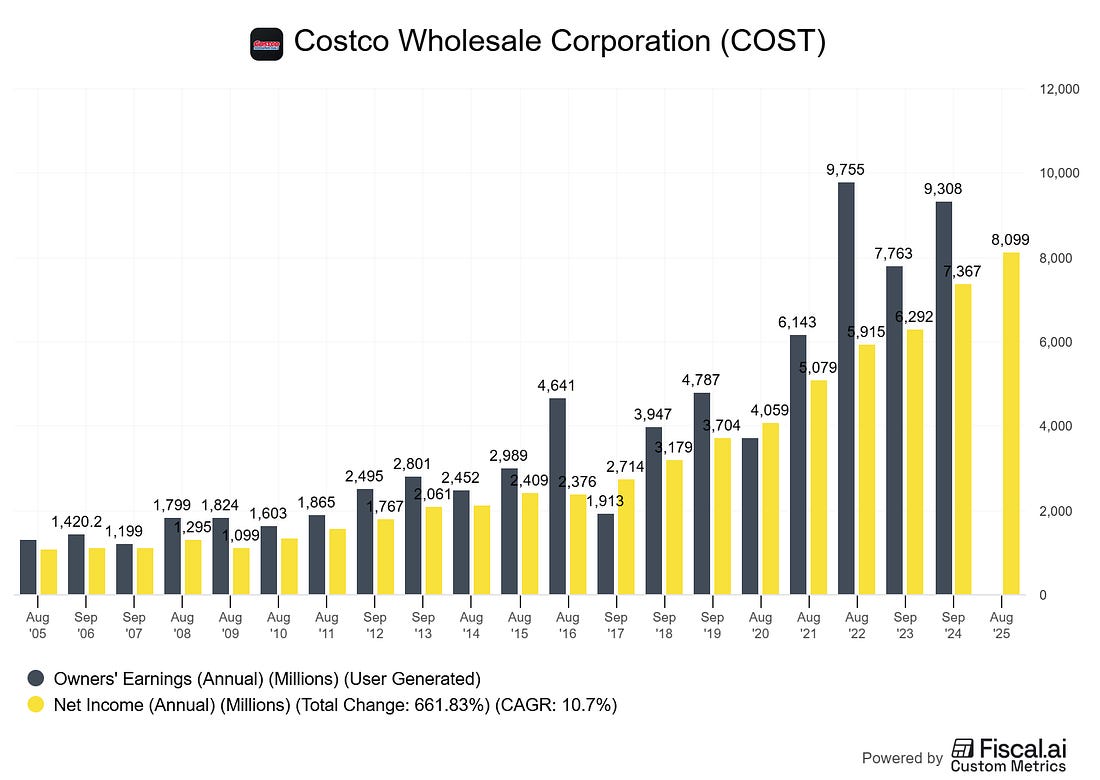
Owner earnings reconciliation (FY2024, illustrative) Start with net income: $7.37B Add back D&A: +$2.24B Adjust working capital: +$0.61B (from cash flow statement) Subtract maintenance capex: unknown; assume a range. Owner earnings range: FCF (unadjusted): OCF $11.34B – Capex $4.71B ≈ $6.63B Takeaway: owner earnings are robust and broadly consistent with high FCF conversion (context: 90%+ of net income). Assumptions matter; disclose them.
Caveats and alternative interpretations CCC can swing by a few days around fiscal year-end due to timing and 52/53-week effects; use multi-year averages. ROIC definitions vary; be explicit. Including/excluding operating leases and deferred membership fees changes the denominator. Owner earnings hinge on maintenance capex estimates; triangulate via store maturity schedules, remodel cadence, and management commentary.
Gather data (primary sources)
Latest 10-K/20-F: income statement, balance sheet, cash flow statement. Notes on revenue composition, membership/deferred revenue, lease accounting, capex guidance. Investor releases for membership fees, renewal rates. Optional valuation context: Yahoo Finance for EV/EBITDA, enterprise value; Macrotrends or filings for margin history. Costco investor relations: Annual report and 10-K Costco Annual Reports (as of 2024). FY2024 10-K filing SEC (as of Sep 1, 2024). FY2024 results release Costco IR (as of Sep 26, 2024). EV/EBITDA snapshot Yahoo Finance (as of Oct 7, 2025).
Compute working-capital cycle
DIO = Avg inventory / COGS × 365 DPO = Avg accounts payable / COGS × 365 DSO = Avg receivables / Net sales × 365 CCC = DIO + DSO – DPO Decision rule: prefer CCC ≤ 10 days (or negative) and stability across cycles. Large swings are a flag.
Reconcile GAAP to owner earnings
Owner earnings ≈ Net income + D&A ± working-capital changes – maintenance capex ± normalization adjustments. Decide on maintenance capex proxy: Decision rule: seek FCF conversion (FCF/NI) > 80% over a cycle, not just a single year.
Estimate ROIC and spread
Pick a consistent invested capital definition. Two practical options: Net capital employed: debt + equity – cash and short-term investments. Operating invested capital: net working capital (ex cash & debt) + net PP&E + operating ROU assets (and other operating assets) – operating liabilities.
Compute NOPAT = operating income × (1 – effective tax rate). Decision rule: sustained ROIC – WACC > 5% indicates durable value creation. For best-in-class retailers, >10% over a cycle.
Per-share framing
Track diluted shares, SBC, buybacks, and dividends. Compute FCF per share and EPS over time. Decision rule: minimal dilution and consistent per-share growth signal discipline.
Capital allocation scorecard
Use a 1–5 scale on: Organic reinvestment returns (store-level economics) Balance sheet prudence (net cash/debt, terming) Distribution policy (dividends/specials vs reinvestment opportunities) Opportunistic buybacks (valuation-aware or not)
“Improving” inventory metrics from stockouts: lower DIO from empty shelves is not quality. Pulling forward payables: temporary DPO boosts can mask deteriorating turns. Capex deferral: short-term FCF lift at the expense of store quality and growth runway. ROIC inflation from narrow definitions: cherry-picking denominator can overstate returns; disclose definitions. Per-share neglect: aggregate growth with dilution doesn’t equal value creation.
ROIC spread: ROIC – WACC > 5% for 5+ years? CCC: stable ≤ 10 days (or negative), DIO in tight band, DSO low, DPO steady. FCF conversion: multi-year FCF/NI > 80%; owner earnings consistent with narrative. Margin bands: gross and operating margins stable (no promotional dependence). Per-share: FCF/share and EPS up; diluted shares flat/down; SBC offset by buybacks. Capital allocation: specials/regulars right-sized; buybacks valuation-aware; net leverage conservative. Evidence of moat: renewal rates, vendor terms, scale cost advantages.
Why is Costco’s margin so low if it’s high quality?
Is negative (or near-zero) CCC always good?
How should I think about maintenance capex?
Triangulate with D&A, remodel cadence, and store growth. Over short windows, use a range; over time, maintenance ≈ portion of D&A plus recurring remodel spend.
Should I include operating leases in invested capital?
Does Costco’s special dividend hurt growth?
ROIC: Return on invested capital; NOPAT over invested capital. WACC: Weighted average cost of capital; blended cost of debt and equity. CCC: Cash conversion cycle; DIO + DSO – DPO, days from cash out to cash in. DIO/DSO/DPO: Days inventory/sales/payables outstanding. Owner earnings: Buffett-style proxy for distributable cash after maintenance capex. SBC: Stock-based compensation; non-cash expense but dilutive unless offset. Capital turns: Revenue divided by invested capital; a key ROIC driver in low-margin businesses. Membership float: Cash collected upfront for services, recognized over time (deferred revenue).
Costco FY2024 Annual Report and 10-K (Sep 1, 2024) — SEC filing and PDF (2024) Costco FY2024 results press release (Sep 26, 2024) Lease accounting and ROIC adjustments — academic and practitioner notes (various, 2019–2024) Negative working capital in retail — industry primers (various, 2020–2024) Owner earnings vs FCF — Buffett 1986 letter; practitioner updates (1986; 2010–2024)
Costco FY2024 10-K (as of Sep 1, 2024): SEC Edgar filing with financial statements and notes SEC filing. Costco FY2024 operating results press release (as of Sep 26, 2024): membership fee revenue and comps Costco IR. Macrotrends: Costco margins time series (as of May 31, 2025) Macrotrends. Yahoo Finance: COST key statistics, EV/EBITDA snapshot (as of Oct 7, 2025) Yahoo Finance. Costco Annual Reports archive (as of 2024) Costco IR Annual Reports.
Educational content, not investment advice. You're currently a free subscriber to School of Investing. For the full experience, upgrade your subscription. Upgrade to paid | |





No comments:
Post a Comment